Figure 2.

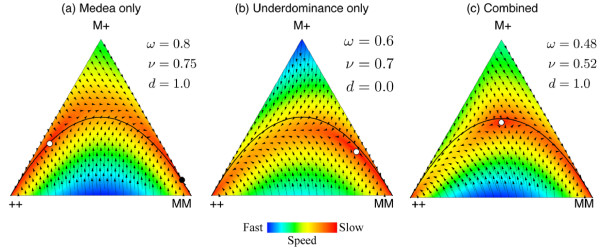
de Finetti diagrams for example parameters. At the vertices the complete population consists of the genotype given by that vertex (++ is for the wildtype homozygote, M+ for the heterozygotes and MM for the transgenic homozygotes). In the interior the population composition is a combination of all the three genotypes with frequencies proportional to the perpendicular distance from the vertex. Unstable equilibrium points are shown as white circles and are always internal within the simplex. Stable equilibrium are shown as black circles and occur on edges (the equilibria which always exist at the ++ and MM corners are not shown). The fitness of the wildtype homozygote is assumed to be 1 and the fitnesses of the other genotypes relative to it are given by ω= heterozygotes and ν= homozygotes. The lethality effect of the Medea allele is given by the parameter d. The three panels describe: (a) “Medea only”, an unstable and stable equilibrium occur. These parameters equate to a strong Medea phenotype associated with a significant fitness cost that is substantially dominant. The M allele frequency at the stable threshold is 0.88 and at the unstable threshold is 0.21. (b) “Underdominace only”, an unstable equilibrium occurs, always in the right half of the simplex.These parameters equate to weak underdominace with a significant fitness cost in transgenic homozygotes. The unstable threshold frequency of the M allele is 0.8. (c) A combined Medea and underdominance system, shows only an unstable equilibrium occurs. We assume multiplicative fitness for ν from the values in (a) and (b), The unstable threshold frequency of the M allele is 0.5, which is the ideal threshold for transformation and reversibility (see Appendix). The black line shows the Hardy-Weinberg equilibrium. Note that the system under study easily diverges from the Hardy-Weinberg null model.
