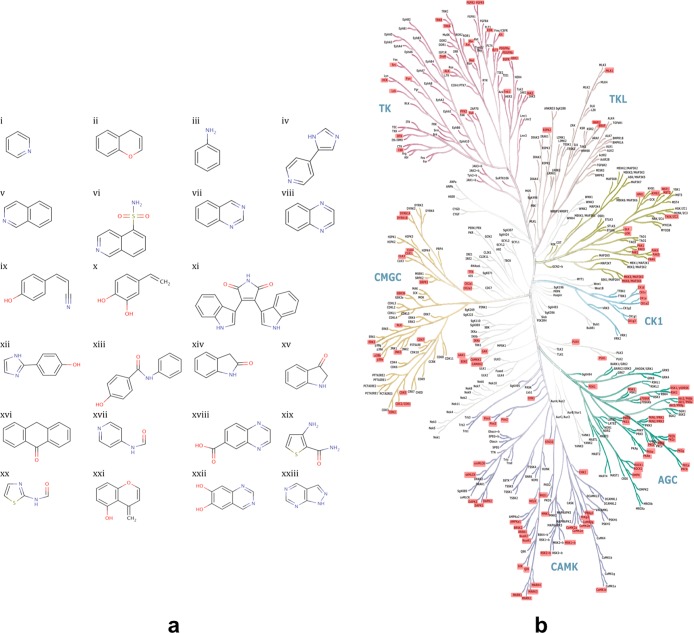
Figure 1.
Explored chemical space. (a) Representative inhibitor scaffolds. Examples of the inhibitor scaffolds included in the panel are shown. All inhibitor structures are provided in the Supporting Information (Supplementary Table 1). (b) Chemical space explored by the panel of inhibitors used in this study. The target(s) in the human kinome for each of the inhibitors of the panel are identified by a red rectangle on the kinome tree. This figure was adapted from the phylogenetic tree published in ref (9).

