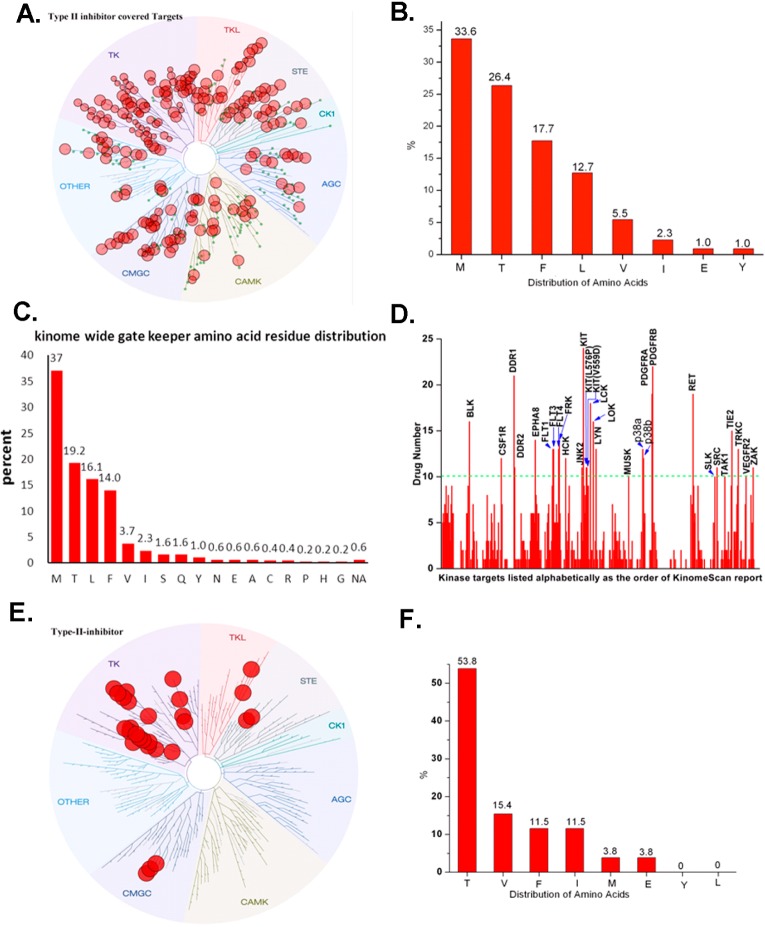
Figure 7.
Analysis of selectivity profiling revealed type II binding kinases. (A) Treespot demonstration of kinase distribution among kinome. (B) Analysis of gatekeeper residues among the type II inhibitor targeted kinases. (C) Analysis of gatekeeper residues among the kinome. (D) Statistics of most targeted kinases by type II inhibitors. (E) Treespot demonstration of most targeted kinase distribution among kinome. (F) Analysis of gatekeeper residues of most targeted kinases by type II inhibitors.

