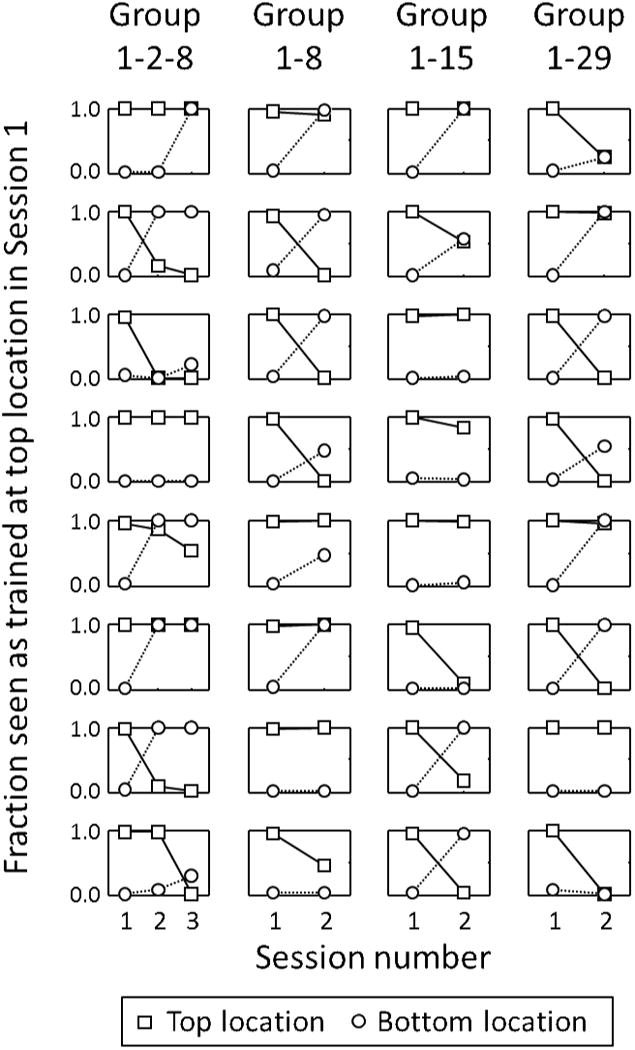
Figure 3.

Individual subject data for the 32 subjects, plotted as fractions (as in Figure 2A-C). Each graph shows data for one of the eight subjects in one of the four groups. The ordinate is the fraction of test trials that appeared to rotate in the same direction as was trained at the top location on Session 1. Squares and circles plot data for test stimuli presented at the top and bottom locations—above and below fixation—respectively. Group 1-2-8 had sessions on Days 1, 2, and 8 of the experiment, and so on.
