
Figure 2.
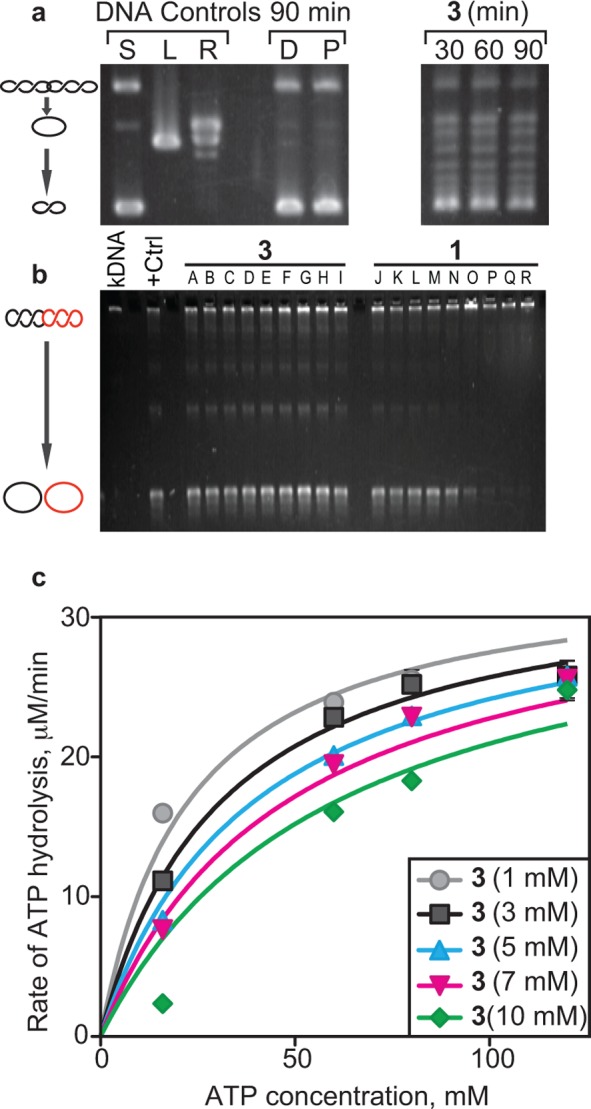
Enzyme activity of DNA gyrase in the presence of 3. (a) In vivo DNA supercoiling activity when treated with 3 for the indicated times. Treatment with 3 reduced the amount of negative supercoiling compared to solvent (D = DMSO) and TolC inhibitor (P = PAβN) controls. (b) Topo IV activity assay using kDNA substrates at different concentrations of 3 and 1. +Ctrl indicates the reaction without any inhibitors. (A) Solvent control (DMSO), (B) 0.078 μM, (C) 0.313 μM, (D) 1.25 μM, (E) 5 μM, (F) 20 μM, (G) 80 μM, (H) 160 μM, and (I) 320 μM 3. (J) Solvent control (50:50 [v/v] of 0.1 M HCl/MeOH), (K) 0.019 μM, (L) 0.078 μM, (M) 0.313 μM, (N) 1.25 μM, (O) 5 μM, (P) 20 μM, (Q) 80 μM, (R) 160 μM 1. (c) In vitro DNA-dependent ATP hydrolysis in the presence of different concentrations of 3. Km, Ki, and Vmax were calculated from the Michaelis–Menten plot shown. ATP assays were performed in triplicate, and error bars indicate standard deviation from the mean. Km varies with increasing concentration of 3; however, Vmax remains unchanged, which is indicative of competitive inhibition.