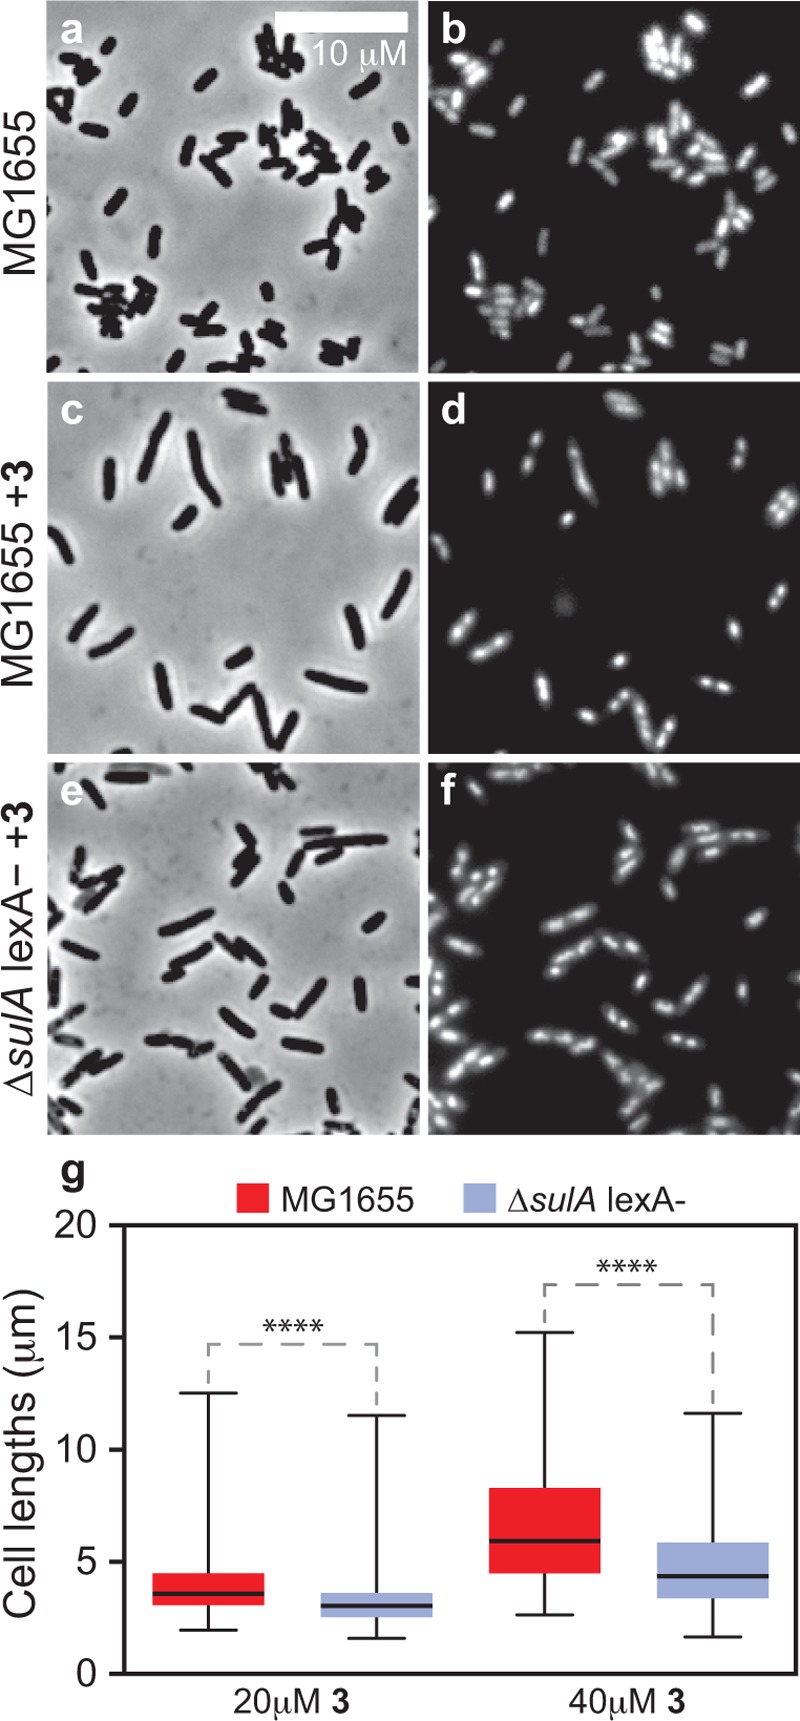
Figure 4.

SulA-dependent inhibition of cell division occurs after treating cells with 3. (a, b) Images displaying the phenotype of untreated WT MG1655 E. coli cells. (c, d) Images demonstrating that WT MG1655 E. coli cells treated with 20 μM 3 for 2 h become filamented. (e, f) Images displaying cells of E. coli MG1655 ΔsulAlexA(ind-) after treatment with 20 μM 3 for 2 h. These cells have a phenotype similar to that of untreated WT cells. (g) Plot quantifying cell lengths after treating E. coli MG1655 WT and ΔsulAlexA(ind-) cells with different concentrations of 3. Mutant cells have a larger distribution of short cells (p-value < 0.0001) when compared to WT, which indicates that cell filamentation to 3 is a result of the SOS response. Error bars represent standard deviations of the mean of 250–300 cells; **** indicates a statistical significance of <0.0001.
