Figure 5.

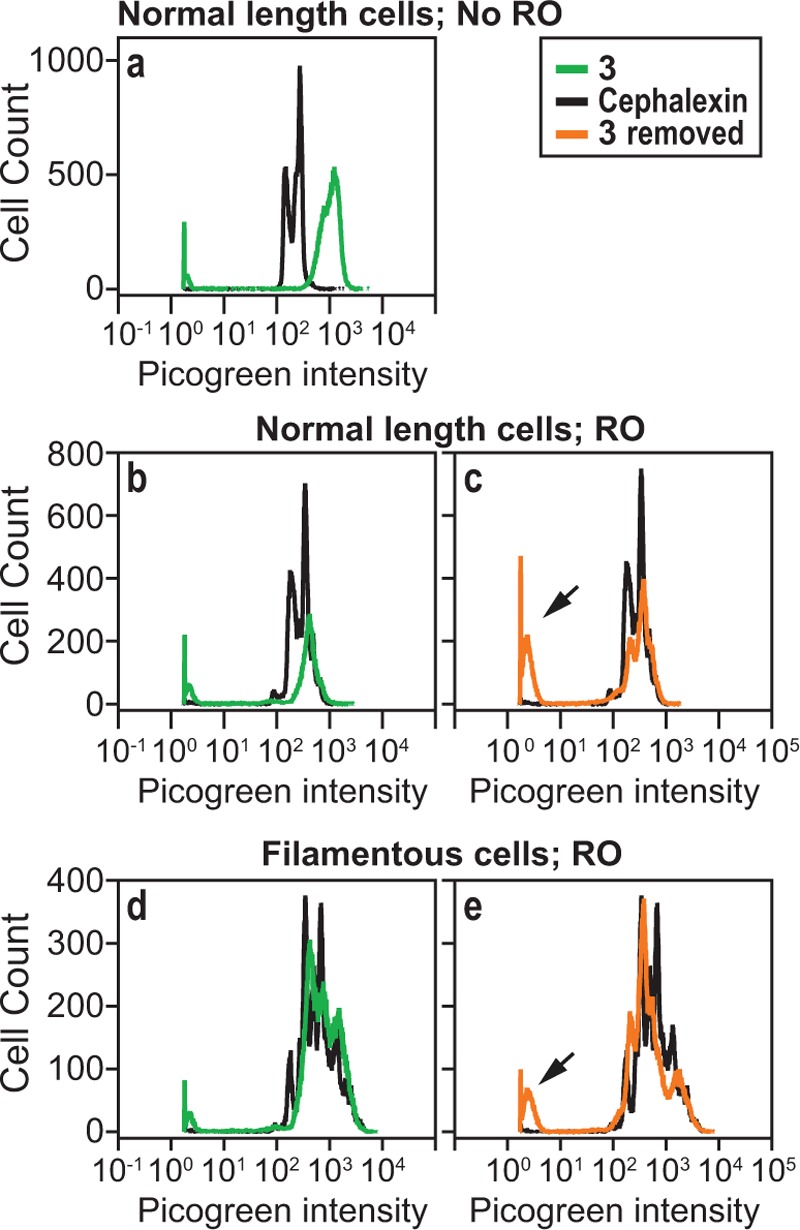
Analysis of DNA content in E. coli ΔtolC after treatment with 3. (a) A comparison of fluorescence intensity (FI) of Picogreen (x-axis) against total number of cells (y-axis) after treatment with 3 (green) and cephalexin (black). “Normal length” refers to cells that have not filamented after treatment with 1 or 3. (b) A comparison of the Picogreen FI of normal length cells treated with 3 (green) and cephalexin (black) with “run-out” (RO) conditions. (c) Picogreen FI of normal length cells in which 3 was washed away after treatment for 2 h, followed by growing cells under RO conditions for 4 h. This data is overlaid against the picogreen FI obtained for cephalexin (black). Picogreen FI of filamented cells (d) after treatment with 3 and RO conditions and (e) in which 3 was washed away after 2 h of treatment and cells were then grown for 4 h under RO conditions. Arrows in panels c and e indicate an increase in the height of the peak corresponding to very low fluorescence intensity, which is characteristic of anucleate cells.
