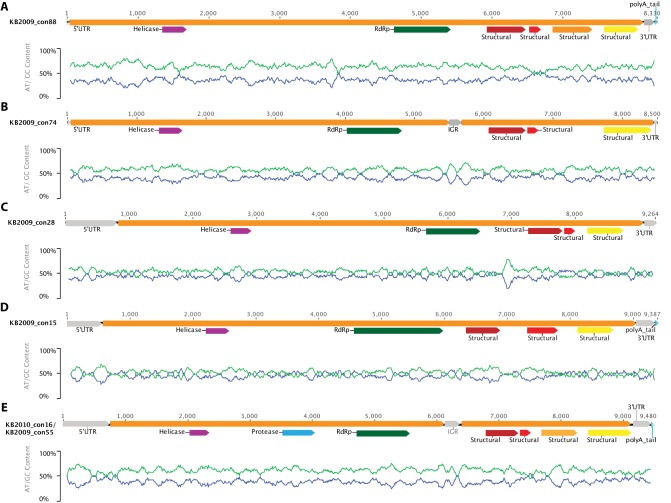
FIG 4 .
Maps of assembled genomes. Genome maps for the 6 complete, or near-complete, genomes assembled from this study (produced in Geneious version 6.1.7) are shown. The unit of measure for the horizontal scale bar is nucleotides. The 5′ untranslated region (UTR), intergenic region (IGR), and 3′ UTR are represented by gray arrows, and the open reading frames and a polyadenylated [poly(A)] tail are represented by orange and turquoise bars, respectively. The identified motifs (see Materials and Methods) are shown with arrows of different colors as follows: helicase, purple; protease, light blue; RNA-dependent RNA polymerase (RdRp), green; structural, wine, red, yellow, and light orange. Under each genome schematic is a graph of GC content along the genome (sliding window frame = 93) where % GC is shown with a blue line and % AT with a light-green one. KB2010_con16 and KB2009_con55 are represented by the same map (E), because they have identical genome organizations (see Results and Discussion). A protease is presumed to be present between the helicase and the RdRP in all genomes, but, in some cases (A to D), there was insufficient similarity to a known protease in this region to map its location.

