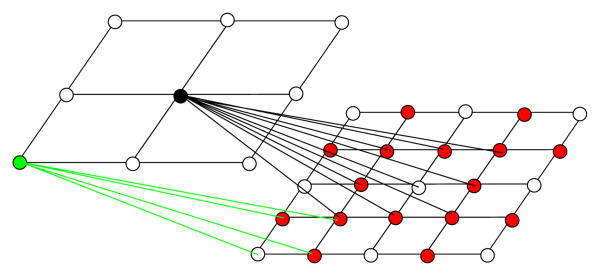
Figure 2.
Visual representation of the grid refinement from level j (left) to level j+1 (right). Grid resampling: the nodes that have direct correspondences appear in white, and the new nodes are red. The edges connecting the 2 grids represent the nodes' neighborhood. The grid is shown in 2D for increased visibility.

