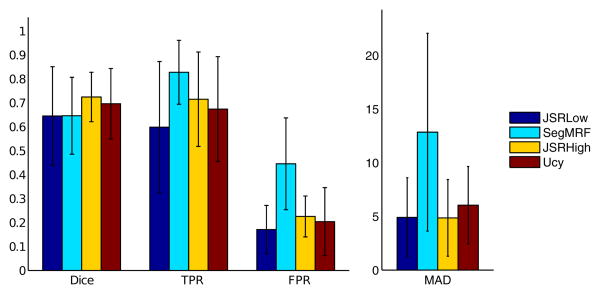
Figure 6.
Quantitative Segmentation Results, BRATS database: Error bars (mean and standard deviation) of the Dice score, False Positive (FPR) and True Positive (TPR) rates and MAD score (in millimeters) for the joint framework with low (JSRLow) and high resolution (JSRHigh), the individual segmentation framework (SegMRF) and the uncertainty based approach (Ucy).

