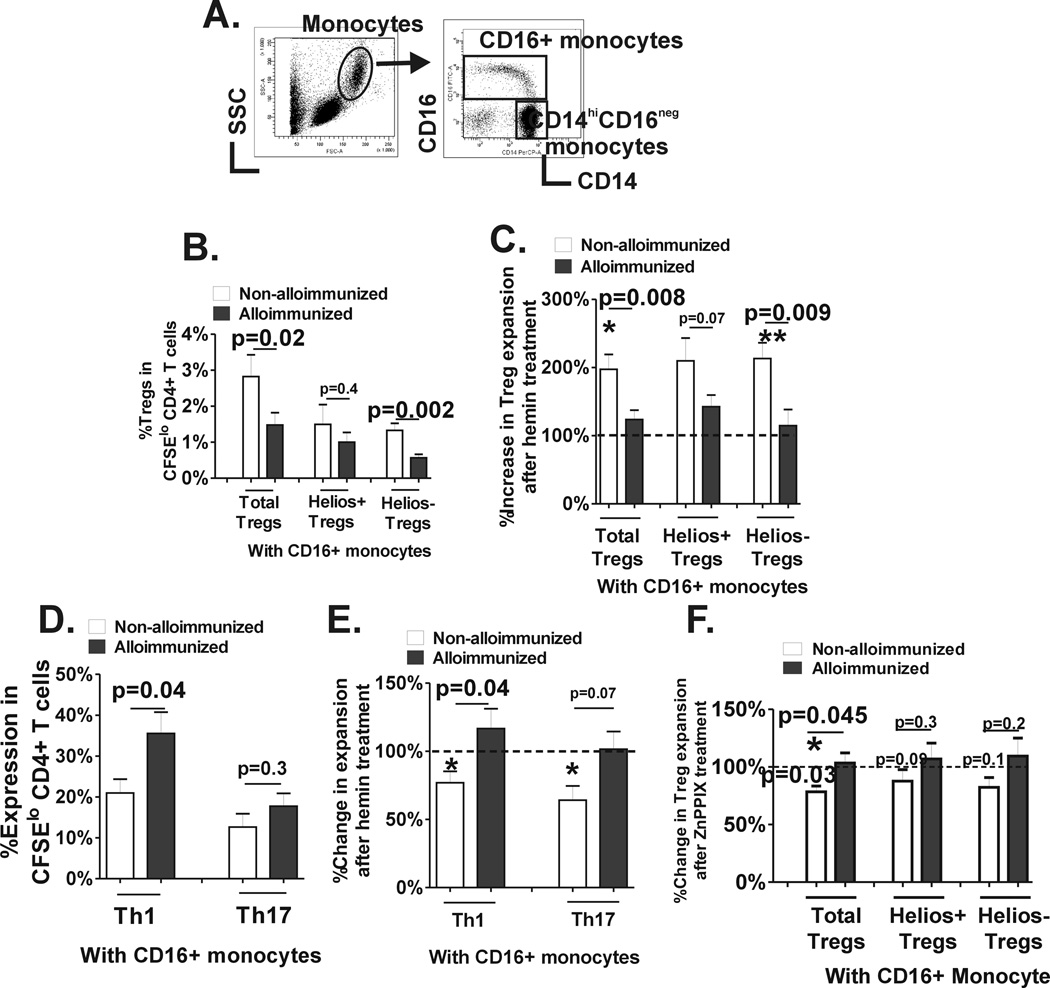
Fig. 4. CD16+ monocyte control of Treg/Th proliferation before and after hemin treatment.
(A) Representative dot plot analysis of PBMCs based on forward and side scatter showing the gating strategy to identify the total monocyte population. Based on CD14 and CD16 expression pattern, CD16+ monocytes are further distinguished from CD14hiCD16− monocyte subset. Purified CFSE stained CD4+ T cells from non-alloimmunized (n=9, white bars) and alloimmunized (n=11, black bars) SCD patients were cocultured with autologous purified CD14+CD16− monocyte subset together with autologous purified CD16+ monocytes followed by stimulation with anti-CD3 for 7 days in the presence or absence of 1.25µM hemin. (B) Frequency of total and Helios helios +/− Treg subsets that had undergone proliferation in the absence of hemin are shown. (C) Fold change in proliferation of total and Helios helios+/− Treg subsets after addition of hemin was calculated (proliferation in the absence of hemin was set at 100%). The asterisks correspond to statistically significant differences in the proliferative responses before and after hemin treatment (paired t test). (D) Frequency IFN-γ+ and IL-17+ cells in divided CD4+ T cells from the same cocultures as in B are shown. (E) Fold change in Th1 and Th17 proliferation after addition of hemin was calculated (proliferation in the absence of hemin was set at 100%). The asterisks correspond to statistically significant differences in the proliferative responses before and after hemin treatment (paired t test). (F) Fold change in Treg proliferation after addition of ZnPPIX was calculated (proliferation in the absence of ZnPPIX was set at 100%). The p value indicated above the column was calculated by paired t test comparing before and after ZnPPIX treatment. All comparisons between alloimmunized and non-alloimmunized groups were performed using Mann-Whitney test.

