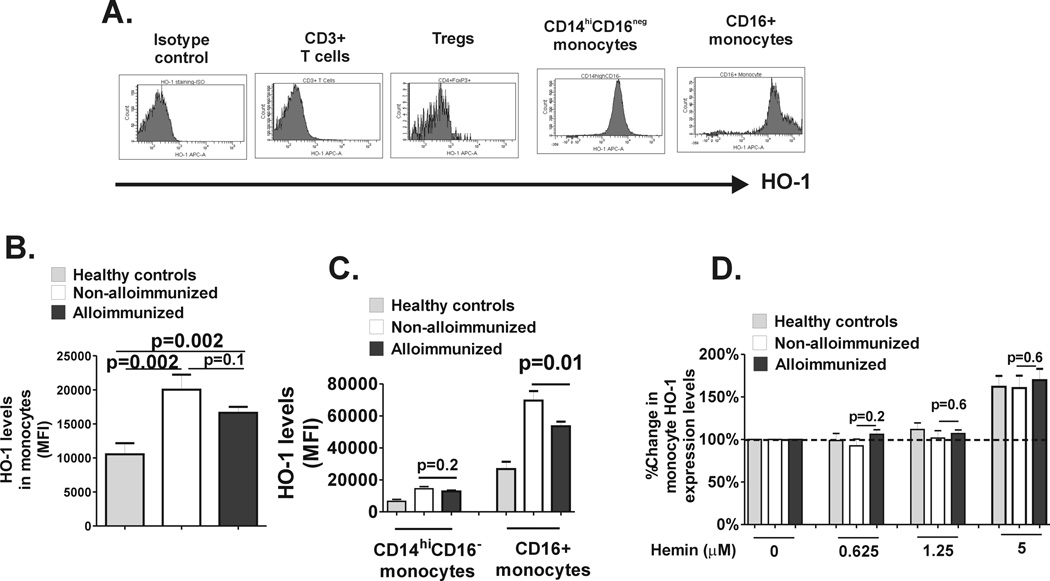
Fig. 5. HO-1 Expression levels of monocyte subset HO-1 levels.
Levels of intracellular HO-1 expression were measured in PBMCs and (A) representative histograms showing isotype control and HO-1 expression in T cells (CD3+) and Tregs (CD25+Foxp3hi) as well as in CD14hiCD16− and CD16+ monocytes are shown. (B) HO-1 expression in total monocyte fraction and (C) in CD14hiCD16− and CD16+ monocyte sunsets in PBMCs from healthy controls (grey bars) and non-alloimmunized (white bars) and alloimmunized (black bars) SCD patient as measured by relative mean fluorescent intensity (MFI) are shown. (D) PBMCs from healthy controls and SCD patients were cultured without (0) or with various concentrations of hemin for 24 hours and fold change in HO-1 expression relative to no added hemin (set at 100%) was calculated. Although at lower concentrations of hemin (0.625µM and 1.25µM), there was no change in HO-1 levels, at higher concentration (5µM), HO-1 expression level was induced (more than 100%). The differences in HO-1 inducibility between the groups were not different at any of the hemin concentrations tested. All comparisons between alloimmunized and non-alloimmunized groups were performed using Mann-Whitney test.

