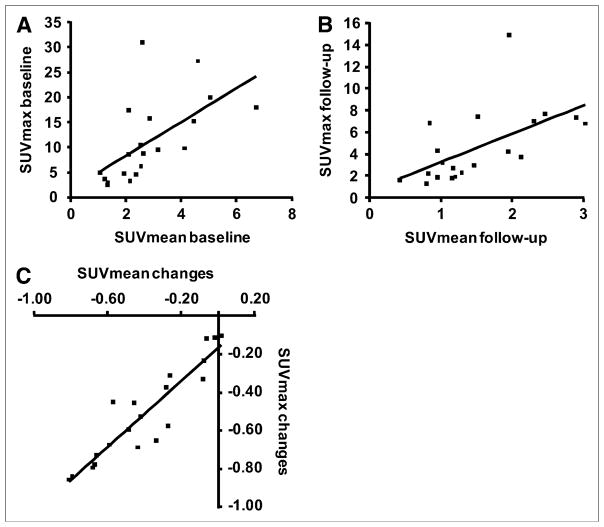
FIGURE 4.
Graphs show correlations between SUVmax and SUVmean at baseline (A) and at follow-up (B) (Pearson correlation coefficient = 0.598 and 0.579, respectively). (C) Relative changes in SUVmax and SUVmean from baseline to posttreatment scan were closely correlated (Pearson correlation coefficient = 0.92).

