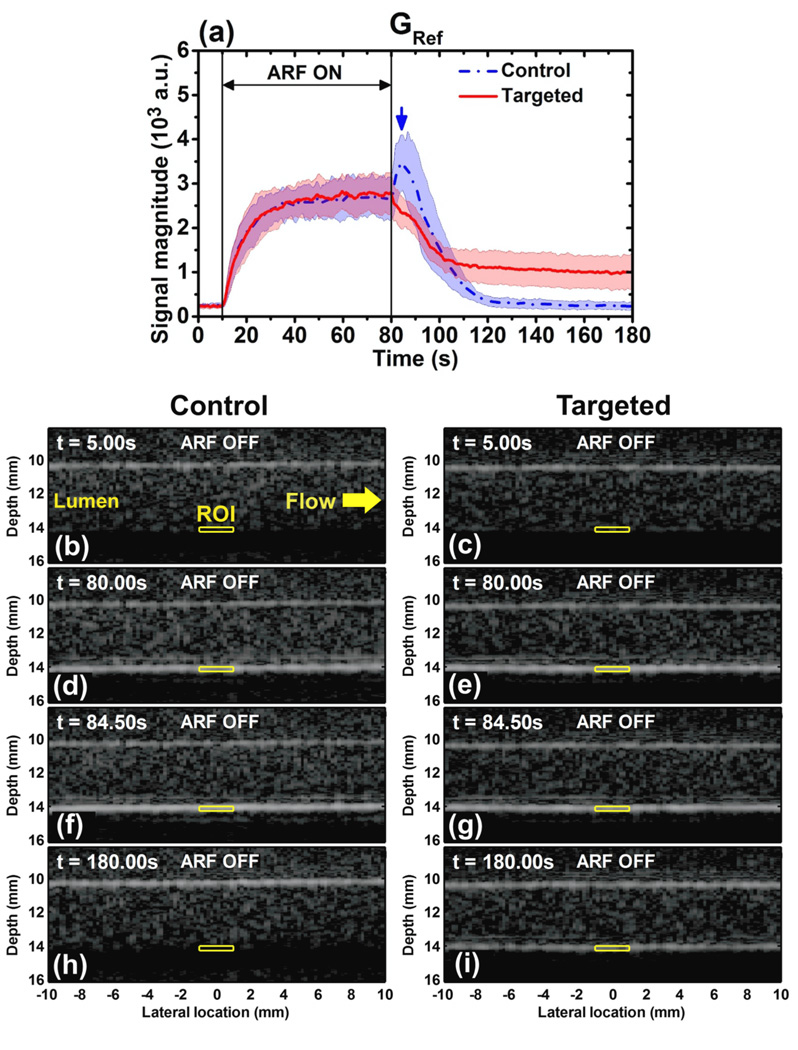
Figure 4.
(a) Averaged signal magnitude curves for control channel (blue) and targeted channel (red) at the acoustic and flow conditions of the reference group, GRef (table 2). Blue dash-dot and red solid lines indicate the mean values from 10 trials. Light color shadows indicate the corresponding error bars at the range of [mean ± standard deviation]. The blue arrow shows the peak of the signal magnitude curve in control channel at t = 84.50 s. B-mode images were displayed at 50 dB dynamic range show the channel lumen of control and targeted channel at different times: (b) control, t = 5.00 s; (c) targeted, t = 5.00 s; (d) control, t = 80.00 s; (e) targeted, t = 80.00 s; (f) control, t = 84.50 s (peak); (g) targeted, t = 84.50 s; (h) control, t = 180.00 s; (i) targeted, t = 180.00 s. Yellow windows indicate the region of interest (ROI) with dimensions of 2 mm × 0.2 mm. Microbubble solution flowed from left to right at a velocity of 6.0 cm s−1.

