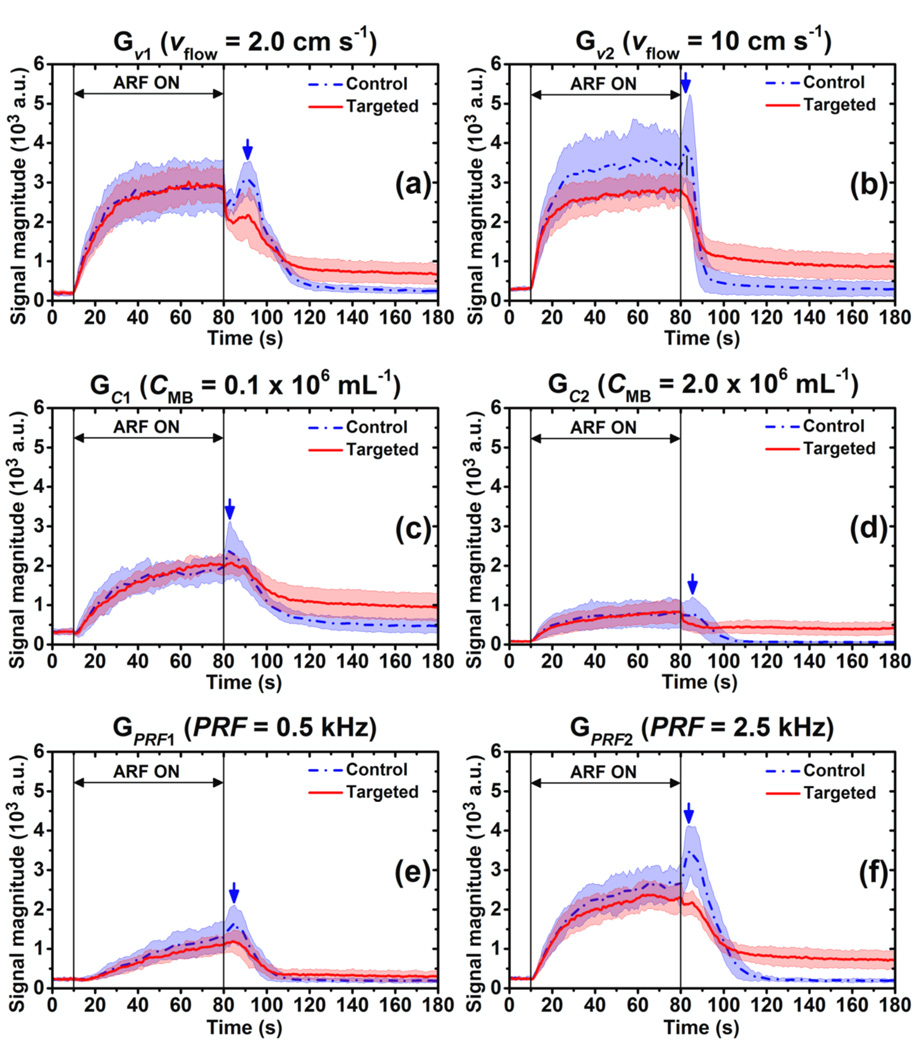
Figure 5.
Averaged signal magnitude curves of control (blue) and targeted (red) channels at different acoustic and flow conditions (table 2). (a) Gν1 (νflow = 2.0 cm s−1) (b) Gν2 (νflow = 10 cm s−1) (c) GC1 (CMB = 0.1 × 10⁶ mL−1) (d) GC2 (CMB = 2.0 × 10⁶ mL−1) (e) GPRF1 (PRF = 0.5 kHz) (f) GPRF1 (PRF = 2.5 kHz) Blue dash-dot and red solid lines indicate the mean values from 10 trials. Light color shadows indicate the corresponding error bars at the range of [mean ± standard deviation]. Blue arrows show the peaks of signal magnitude curves of control channel at different groups: Gν1, t = 90.75 s; Gν2, t = 82.50 s; GC1, t = 83.00 s; GC2, t = 85.50 s; GPRF1, t = 85.00 s; GPRF2, t = 84.50 s.

