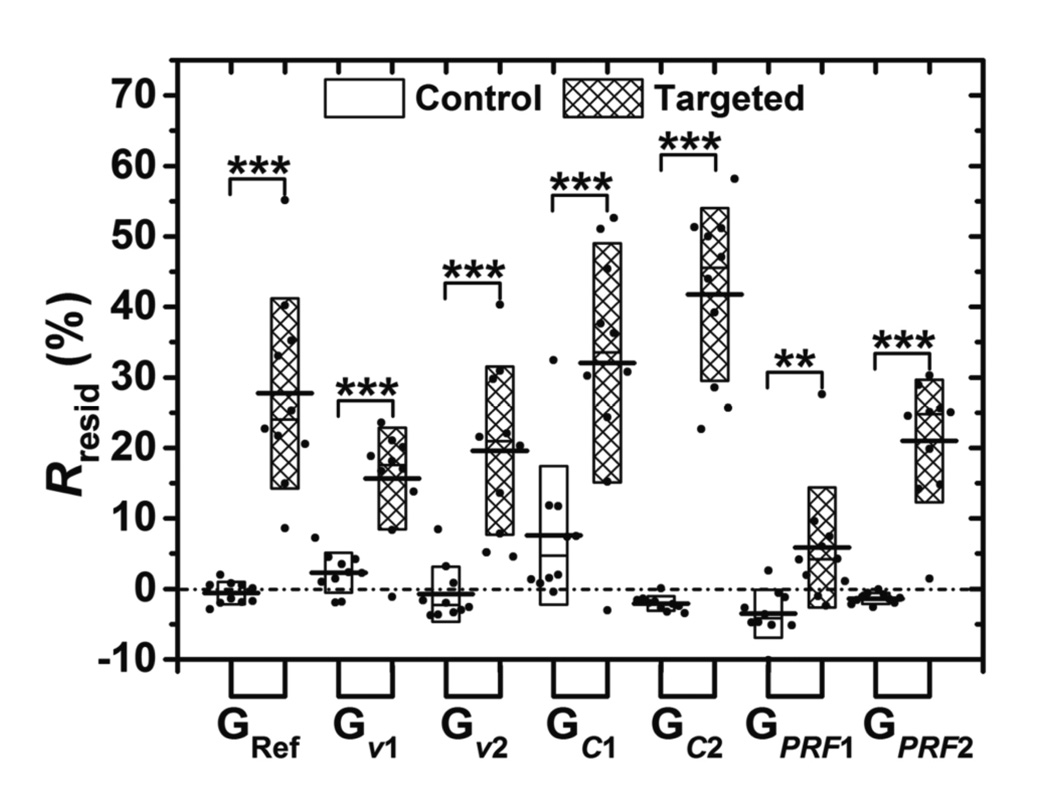
Figure 9.
The Rresid parameter across the various imaging conditions tested in this study. Boxes (empty for control channel and filled for targeted channel) show the range of [mean ± standard deviation]. Black lines located at the center of the boxes show the corresponding mean value. Raw data from 10 trials are shown as solid dots overlaid with corresponding boxes. For Student’s t-test, **: p < 0.01, ***: p < 0.001, n = 10.

