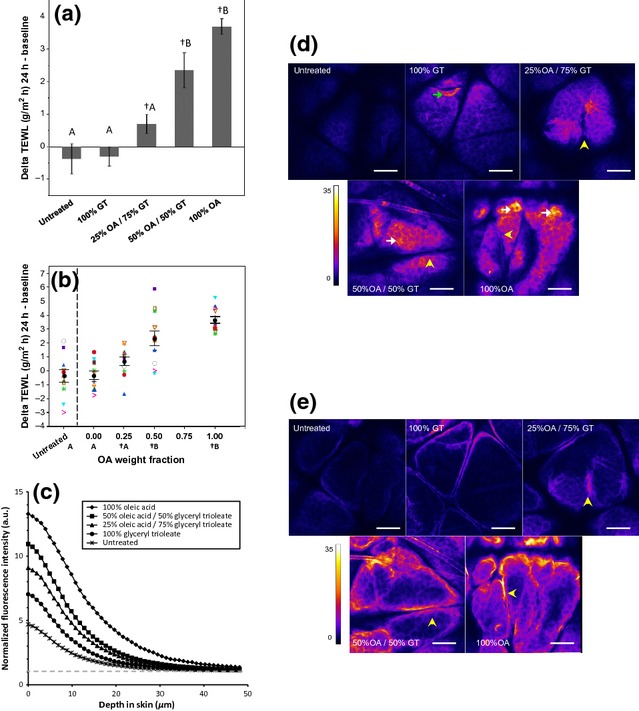
Figure 1.

Application of Oleic Acid (OA), but not Glyceryl Trioleate (GT), disrupts skin barrier function. (a) Average changes in TEWL at untreated control sites and sites treated with OA, GT and their mixtures. TEWL increases over baseline values in sites treated with OA and OA/GT mixtures (†, P < 0.05, paired t-test), but not in untreated sites and sites treated with 100% GT. The TEWL increase in sites treated with 100% OA and 50% OA/50% GT is greater than that in sites treated with 25% OA/75% GT, 100% GT and untreated control (treatments not connected by the same letter are significantly different, one-way ANOVA with Tukey's HSD post-test, P < 0.05). Error bars represent 1 standard error of the mean (SEM). (b) When GT is considered to be the vehicle, a dose response in change in TEWL with increasing weight fraction of OA is observed. Within-subject trends follow trends observed in mean values (black circles represent the mean, and error bars represent 1 SEM). (c) Penetration of sodium fluorescein is measured in vivo through fluorescence confocal microscopy. Fluorescence intensity profile, normalized to laser power, is higher at the surface of the skin in sites treated with OA and OA/GT mixtures. Elevated fluorescence is observed throughout the stratum corneum and into the viable epidermis. Background signal is indicated by the grey dashed line. (d,e) Representative normalized fluorescence images at the surface of the SC (d) and 20 μm into the skin (e). Localized areas of elevated fluorescence are observed at the surface of the skin (white arrows) and in clumps of partially desquamated corneocytes (green arrow). Fluorescence is observed in the bottom of glyphics, but not at the surface (yellow arrowheads). Scale bars are 100 μm.
