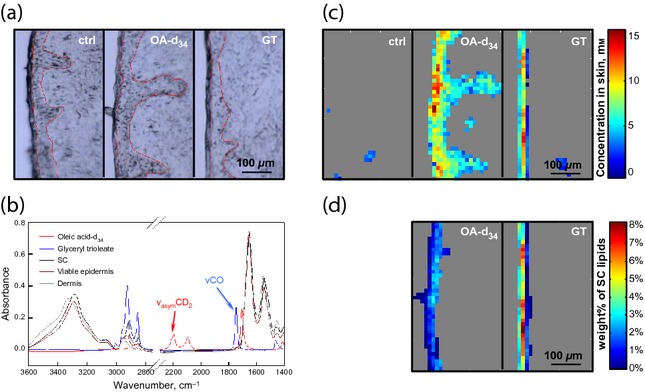
Figure 2.

Detection of OA-d34 and GT penetration ex vivo. (a) Microscopic images of skin cross-sections, with the SC located to the left of each image. The untreated control sample and samples treated with OA-d34 and GT are placed from left to right. The SC/viable epidermis and viable epidermis/dermis boundaries are outlined with thin red lines. (b) IR spectra of pure OA-d34 (red), GT (blue), SC (black), viable epidermis (brown) and dermis (grey). (c) Images from the same sections shown in (a) of OA-d34 or GT concentration in untreated control, OA-d34 concentration in OA-d34 treated skin and GT concentration in GT treated skin, left to right, respectively. Detection limits were set with thresholds on the peak height at 2196 or 1742/cm to minimize detection in the untreated control sample, as no deuterated compounds and/or minimal amounts of esters (with sebum removed by tape stripping) were present in the untreated skin. (d) Levels of OA-d34 and GT in SC regions expressed as the mass percentage of endogenous SC lipids.
