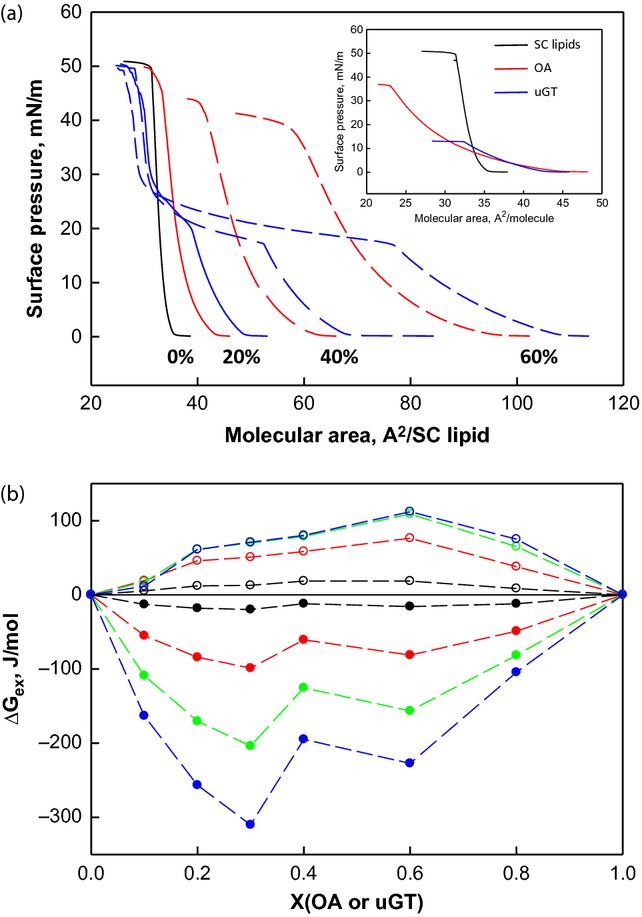
Figure 3.

Interactions of OA or GT with model SC lipids in monolayers. (a) π-A isotherms of SC lipids (black), SC lipid/OA mixtures (red) and SC lipid/uGT mixtures (blue). The mole percentage of OA or uGT in the mixtures is labelled on the graph. Inset: π-A isotherms of SC lipids (black), OA (red) and uGT (blue). (b) The excess energy of mixing for SC lipid/OA mixtures (filled circles) and SC lipid/uGT mixtures (open circles) at 1 (black), 5 (red), 10 (green) and 15 (blue) mN/m as a function of monolayer composition.
