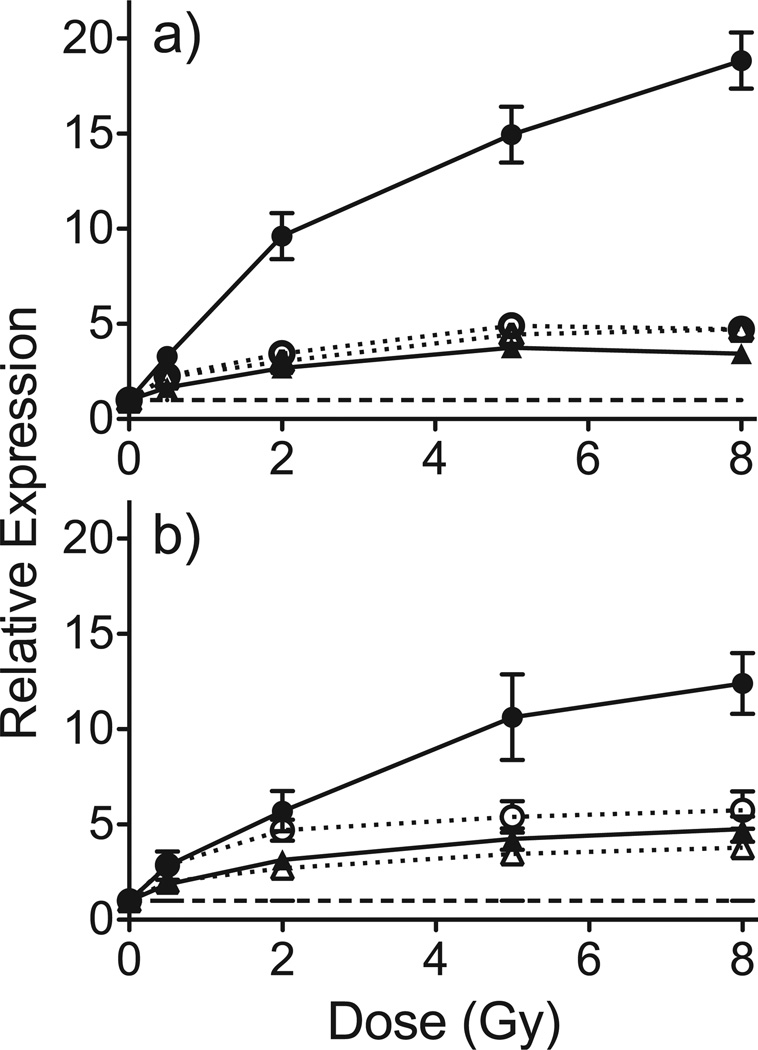
FIG. 1.
Relative expression of CDKN1A (●), DDB2 (○), PCNA (▲) and PHPT1 (△) at 48 h after ex vivo irradiation as determined by qRT-PCR (panel a) and microarray hybridization (panel b). Points denote mean response of 5 independent donors and error bars denote standard error of the mean (SEM). The dashed line indicates the expression level in unirradiated controls.

