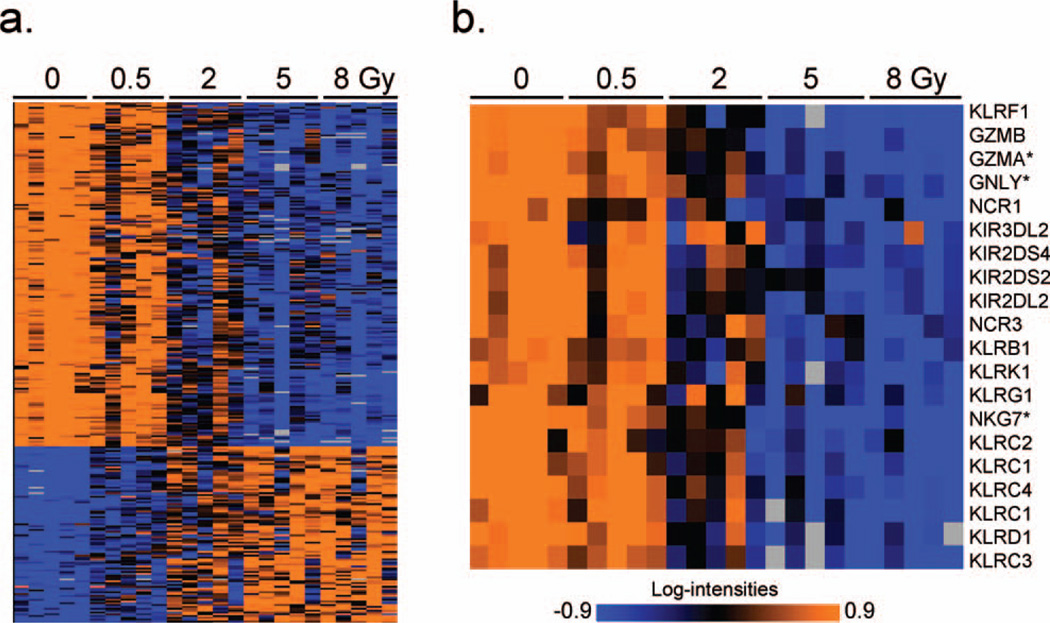
FIG. 2.
Panel a: Average linkage clustering of genes differentially expressed across doses at 48 h postirradiation. Annotation of all genes in clustered order is presented in Supplementary Table S1. High expression is depicted as orange and low expression is depicted as blue. Exposure dose (in Gy) is labeled across the top of the panel. Panel b: Heat map illustrating the expression pattern of 20 NK cell associated genes (identified by BRB annotation) significantly down-regulated at 48 h post exposure. Gene names are shown along the right edge of the figure and dose (in Gy) is labeled across the top of the panel. Genes used for qRT-PCR are marked with an asterisk (*).

