
Fig. S3.
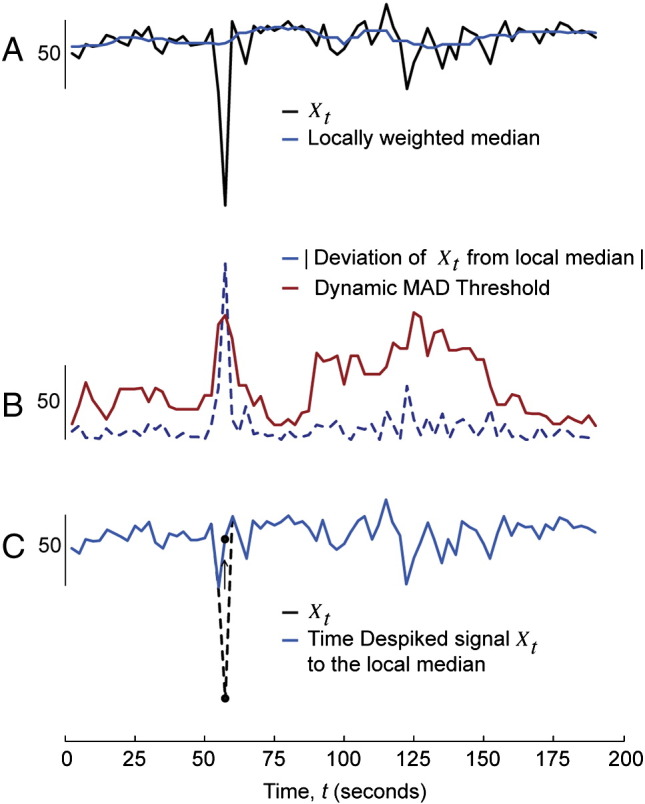
Guided example of the Time Despike method. For each time point in time series Xt, the local median was first calculated from a local region (4 × 4 window) of values in the neighborhood of that time point (A). The local Median Absolute Deviation (MAD) was then calculated for each time point across this same window (B). Any time point that had a larger value than the MAD multiplied by a threshold value of 6.8, was despiked to the level of the local median (C). Please see the Time Despike section for more details.