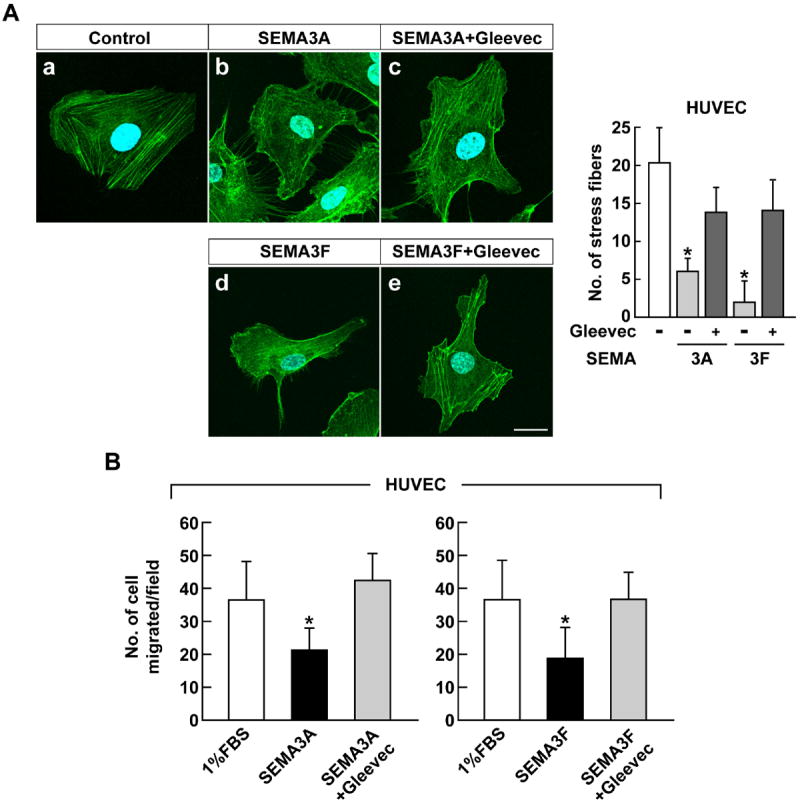
Figure 3.

Gleevec abrogates the effect of SEMA3A and SEMA3F in HUVEC. A, HUVEC were pre-treated with 50 μM Gleevec for 1 hour before SEMA3 (320 ng/ml) treatment. After 45 minutes, cells were fixed and stained with Alexa Fluor 488 phalloidin and DAPI and observed by confocal microscopy. The right panel shows the quantification of stress fibers. Data represent the mean ± SD (n = 3), * p < 0.05. The scale bar indicates 20 μm. B, HUVEC were treated with Gleevec (10 μM) prior to 1 hour of SEMA3A or SEMA3F (160 ng/ml) treatment and assessed for their ability to migrate through transwells. Data represent the mean ± SD, * p < 0.05 vs. 1% FBS-treated group.
