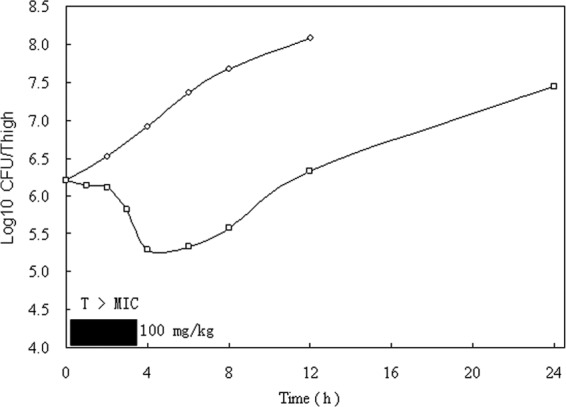
FIG 2.

In vivo PAE of cefquinome at doses of 100 mg/kg against S. aureus in neutropenic mice. Each symbol represents the mean values from data from two mice (four thighs). The width of the solid bar represents the duration of time that free drug levels remained above the MIC of the infecting pathogen.
