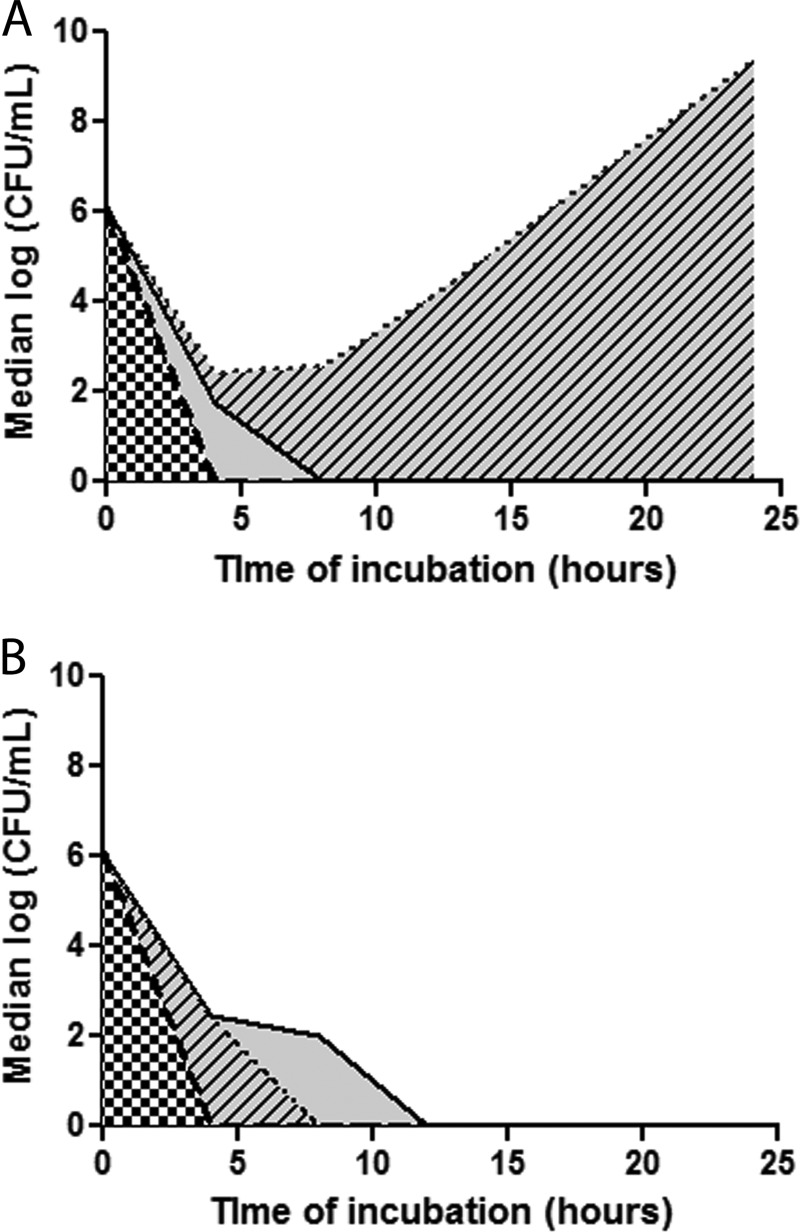
FIG 2.
Median AUBCs for 2-drug combinations against KPC-K. pneumoniae isolates, stratified by ompK36 genotypes. Shown are time-kill results against ins aa134-135GD mutants (A) and wild-type/minor mutants (B). Data represent the median log10 CFU/ml for specific combinations over time. The black dotted line represents median time-kills by DOR+COL. The solid black line and the thick broken black lines represent median time-kills by DOR+GENT and GENT+COL, respectively. Therefore, the AUBCs highlighted by black-and-white checkers depict the activity of GENT+COL, and AUBCs highlighted by solid gray and gray with black diagonal lines depict the differences observed with DOR+GENT and DOR+COL, respectively.

