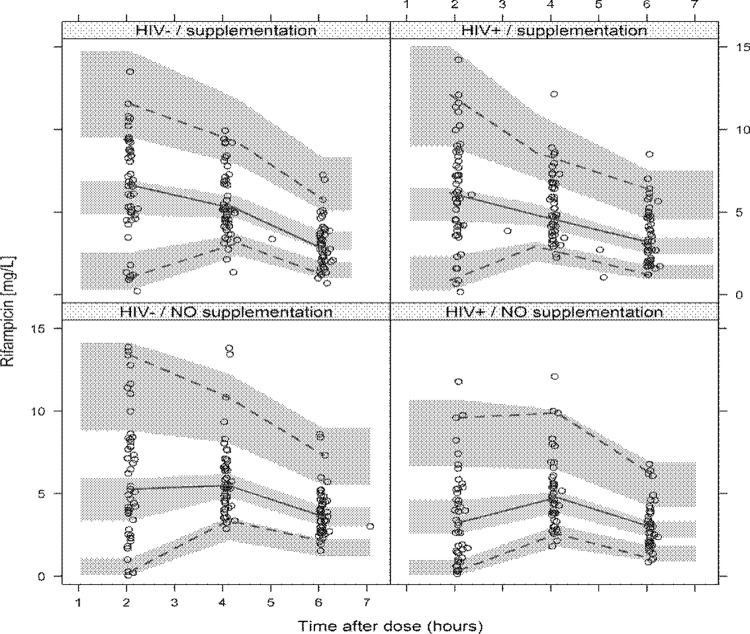
FIG 2.
Prediction-corrected visual predictive check (pcVPC) for rifampin concentration versus time, stratified by HIV status and use of nutritional supplementation. The circles represent the original data, and the dashed and solid lines are the 5th, 50th, and 95th percentiles of the original data, while the shaded areas are the corresponding 95% confidence intervals, as predicted by the model.

