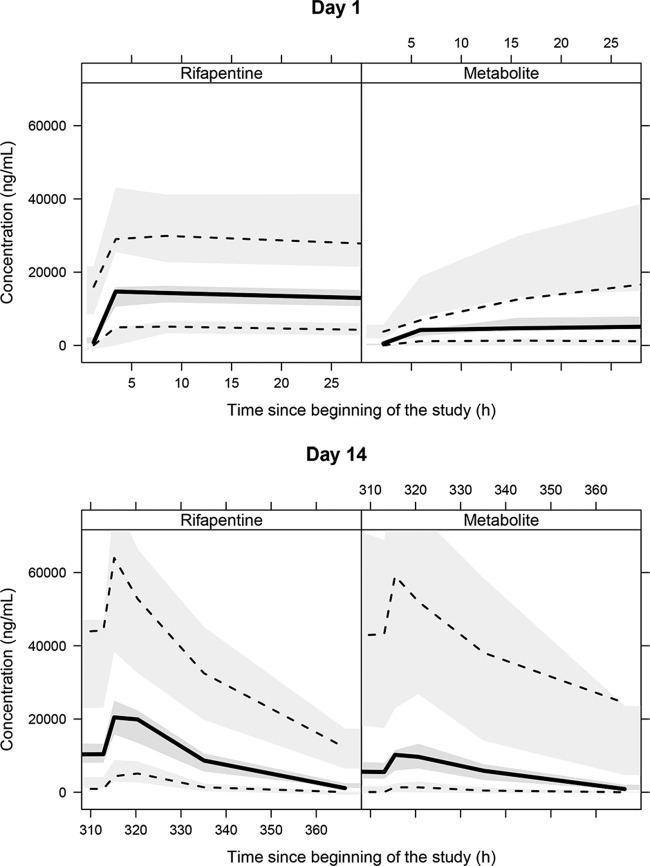
FIG 4.
Visual predictive check for blood levels of rifapentine (left) and metabolite (right) for different days on treatment. Solid black lines, median of the observed data; dotted black lines, 5th and 95th percentiles of the observed data; middle gray shaded area, simulated median with uncertainty (for 500 repetitions of the visual predictive check); lower and upper gray shaded areas, simulated 5th and 95th percentiles with uncertainty, respectively.

