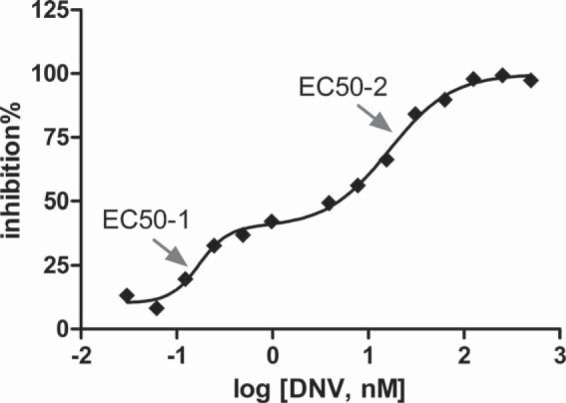
FIG 2.

Biphasic DNV dose-response curve obtained by NS3 phenotyping of the patient 1 follow-up week 12 sample. The percentage of replicon inhibition is plotted against the log10 DNV concentration, and the data were fitted using the biphasic program in GraphPad Prism (version 5) for Windows (GraphPad Software, San Diego, CA). The arrows indicate EC50s calculated for the first and second phases. One representative of 4 independent experiments is shown.
