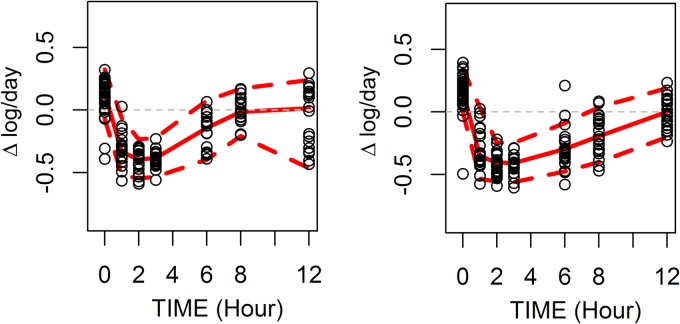
FIG 2.
Visual predictive check of model. (Left) Dosing at 600 mg BID; (right) dosing at 1,200 mg QD. Symbols indicate individual observations; solid lines, model predictions; dashed lines, 5th to 95th prediction intervals. The wide confidence interval at 12 h in the 600-mg-BID arm was due to a delay of up to 1 h postdosing in obtaining the 12-h specimen from 7 subjects.

