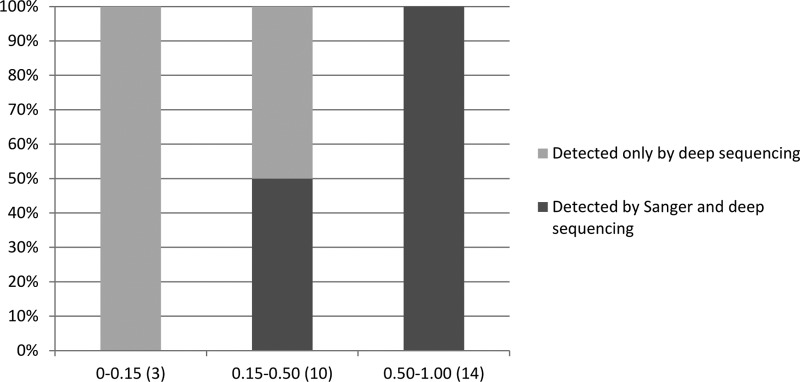
FIG 2.

Comparison of gyrA and gyrB resistance-conferring mutations plotted by the proportion of reads at each locus as detected by Sanger sequencing and Illumina deep sequencing. The proportion of heteroresistance by deep sequencing (number of isolates per group) is shown on the x axis, and the percentage of isolates with heteroresistance detected by Sanger sequencing is shown on the y axis.
