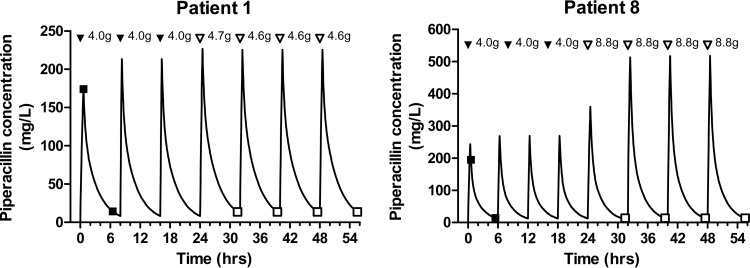
FIG 6.
Predicted piperacillin concentration-time profiles for patients 1 and 8. The observed data entered into the software package (●) and the predicted piperacillin concentration (solid line) are shown. At the top of each graph, each arrowhead represents an administered dose (doses administered prior to individualization [all bolus doses] [▼] and doses administered following individualization [administration over 30 min for bolus doses] [▽]). The therapeutic drug target was a trough piperacillin concentration of 13.6 mg/liter.

