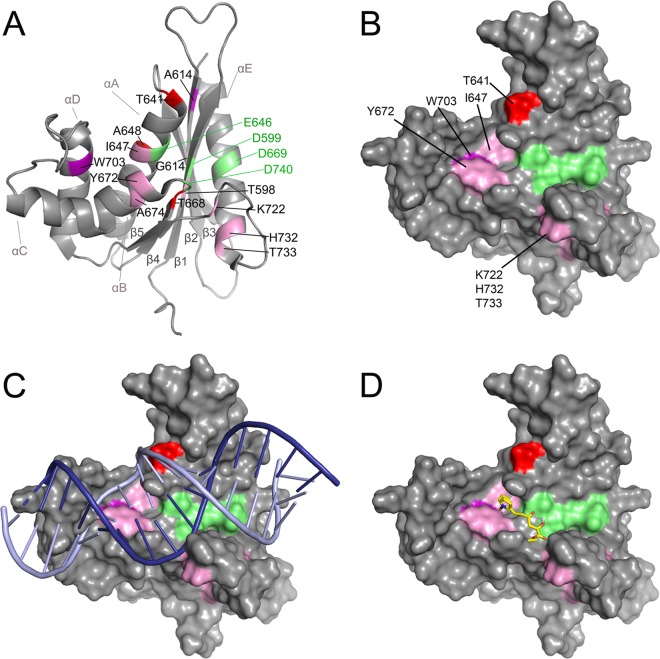
FIG 4.
Identification of the putative inhibitor binding site on the structure of PFV RNase H. The normalized chemical shift changes (weighted geometric average of 1HN and 15N chemical shift changes) are shown in the PFV RNase H. Amino acids showing significant chemical shift changes at an RDS1643 concentration of 3.9 mM are highlighted. Changes of ≥0.02 ppm are illustrated in pink, changes of >0.03 ppm are shown in violet, and changes of >0.04 ppm are shown in red. The active-site residues are represented in green. (A) Ribbon presentation of PFV RNase H (PDB ID 2LSN). (B) Surface presentation of PFV RNase H highlighting the surface-exposed residues with significant chemical shift changes. (C) Surface presentation of PFV RNase H with an RNA/DNA hybrid. Based on the structure of the human RNase H-substrate complex (PDB ID 2QK9), a structural alignment of the PFV and human RNase H was performed to model the RNA/DNA substrate of the human RNase H onto PFV RNase H (root mean square deviation [RMSD], 2.35 Å) (8). The RNA strand is shown in dark blue and the DNA strand in light blue. (D) Inhibitor modeling. RDS1643 was modeled onto the structure of the PFV RNase H using the modeling program AutoDock Vina (29).

