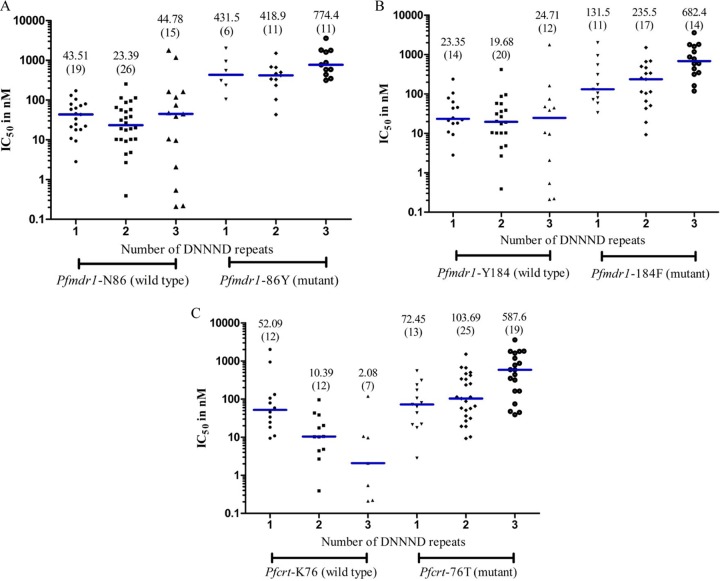
FIG 5.
Relationship between the QN IC50 and the genotype combination of DNNND repeats for Pfmdr1-86 (A), Pfmdr1-184 (B), and Pfcrt-76 (C). The analysis comparing the number of DNNND repeats with each allele was done using the Mann-Whitney test. The horizontal bars (blue) indicate the medians. The numbers of isolates analyzed are shown in brackets. With one exception, 3 DNNND repeats had statistically significantly higher QN IC50 values than did isolates with 1 or 2 repeats for all mutant alleles analyzed. The association of Pfmdr1-86Y with 1 versus 3 DNNND repeats was not statistically significant (P = 0.21).

