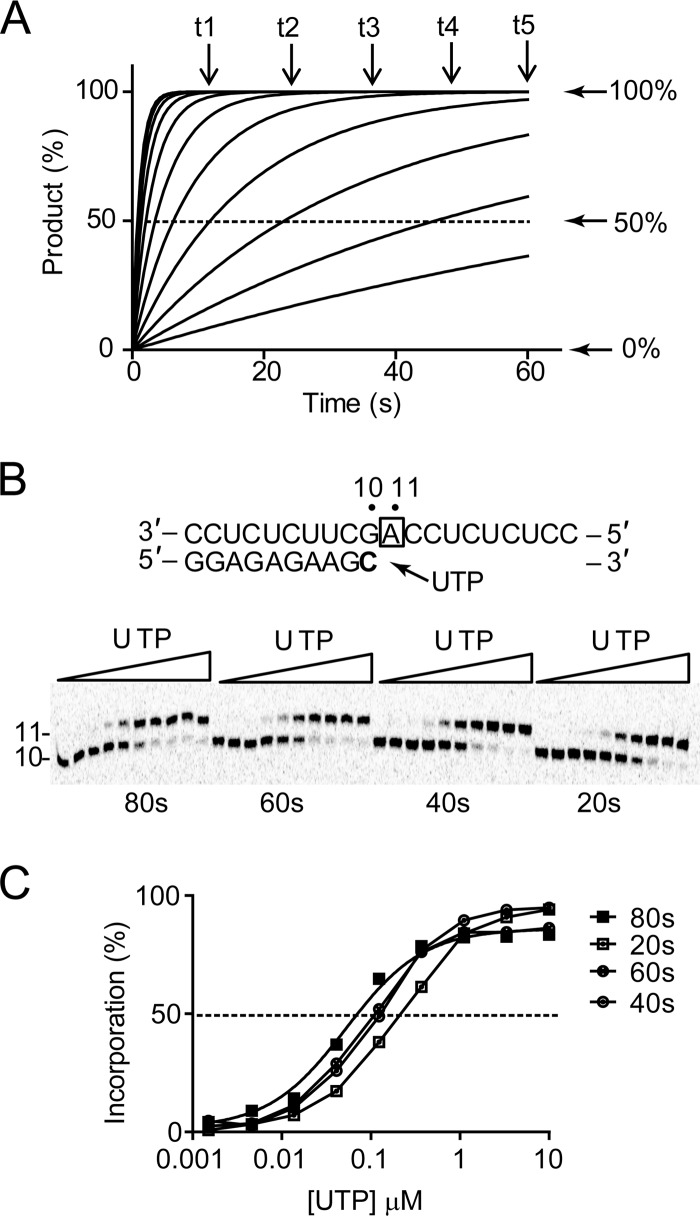
FIG 5.
Single-turnover kinetics of nucleotide incorporation. (A) Simulated progress curves of product formation at various nucleotide concentrations. Single-nucleotide incorporation was simulated using arbitrary values of Kd of 100 μM and kpol of 1 s−1, resulting in a theoretical specificity or substrate efficiency, kpol/Kd, of 0.01 s−1 μM−1. (B) Single incorporation of UMP opposite template A. High-resolution Tris-borate-EDTA–urea gel electrophoresis shows the extension of 10- to 11-mer RNA products. Increasing concentrations of UTP ranging from 0.0015 to 10 μM were added to start the extension reaction. Four different time points were measured to evaluate the effect of time on K1/2 and on kpol/Kd. The boldfaced “C” represents the radiolabeled nucleoside. The box around “A” represents the opposing nucleoside to the incoming nucleotide. (C) Quantitative analysis of product formation. For each time point, percent UMP incorporation was calculated and plotted as a function of UTP concentration. The data were fit to a sigmoidal dose-response equation (equation 1) to obtain K1/2 values, as reported in Table 1.

