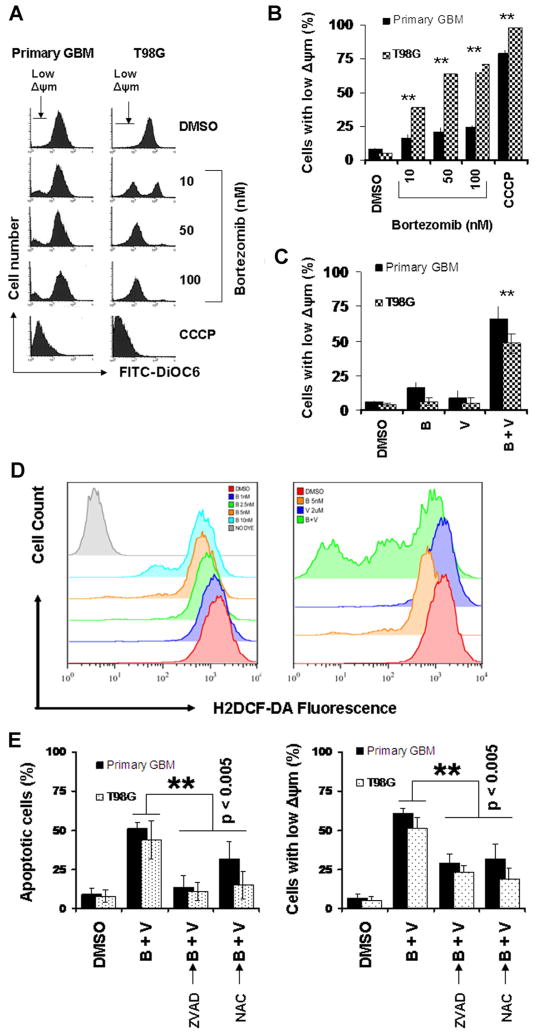
Figure 2.
Combination of bortezomib and vorinostat induces loss of mitochondrial potential and release of ROS, and activates the intrinsic apoptotic pathway. (A and B) Primary tumor cells (primary GBM) and T98G cell line were treated with the indicated concentrations of bortezomib for 24 h. Control cells received equivalent amount of DMSO. Cells were then loaded with DiOC6 and mitochondrial membrane potential was analyzed by flow cytometry as described in the Materials and Methods Section. CCCP served as positive control (50 μM). Note the appearance of a subpopulation of cells with decreased fluorescence (cells with low Δψm) in a dose-dependent manner (A). Bar chart represents the cells with low Δψm (mean ± SD) from three independent experiments (B). Asterisks indicate significant differences in relation to untreated control (**P < 0.005). (C) Primary tumor cells and T98G cell line were treated with bortezomib (5 nM), vorinostat (2 μM) or the combination of bortezomib plus vorinostat (B + V) for 24 h. Loss of mitochondrial membrane potential was determined by DiOC6 staining and flow cytometry. (D) Analysis of ROS generation by H2DCF-DA staining and flow cytometry. Primary tumor cells were exposed to the indicated concentration of bortezomib (left). Increasing the dose of bortezomib resulted in a decrease in the H2DCF-DA fluorescence intensity. Co-treating cells with bortezomib + vorinostat (B + V; bortezomib 5 nM + vorinostat 2 μM) for 24 h provoked much lower H2DCF-DA fluorescence intensity than the single agent alone (right). (E) Primary tumor and T98G cells were pretreated with 25 μM ZVAD-fmk (pan caspase inhibitor) or 5 mM NAC (ROS scavenger) for 2 h followed by the combination of bortezomib (5 nM) plus vorinostat (2 μM, B + V) for 24 h. Control cells received equivalent amount of DMSO. Apoptosis (annexin V binding, left) and loss of mitochondrial membrane potential (Δψm, DiOC6 assay, right) was analyzed by flow cytometry as described in the Materials and Methods Section. Data are representative of triplicate in three independent experiments (**P < 0.005).

