
Figure 1.
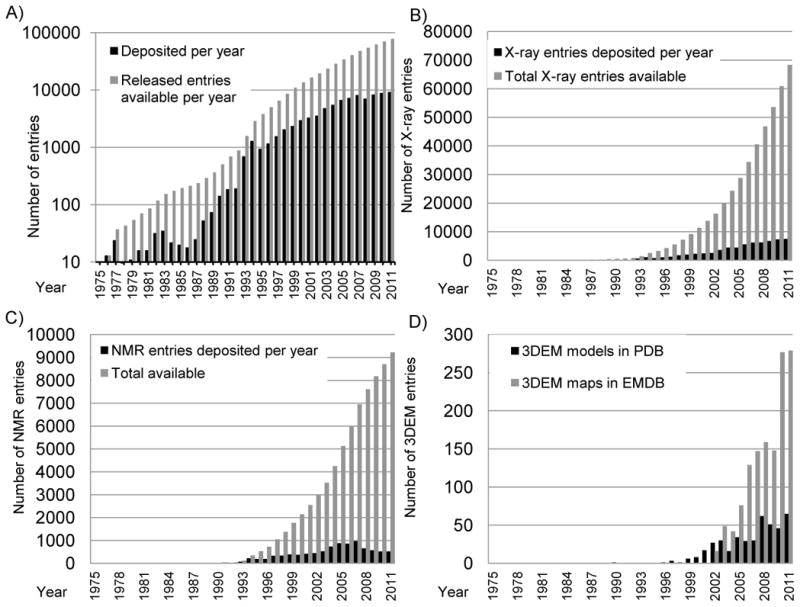
Growth of the PDB archive. A) Depositions per year are shown in black and total released entries available in gray on a logarithmic scale. Reprinted from Berman [46] with permission from Wiley; B) Growth of depositions from X-ray crystallography. Depositions per year are shown in black and total released entries available in light gray; C) Growth in depositions from NMR. Depositions per year are shown in black and total released entries available in light gray; D) Growth in depositions from 3DEM. Depositions per year of 3DEM maps are shown in light gray and depositions per year of model coordinates in black.