
Figure 5.
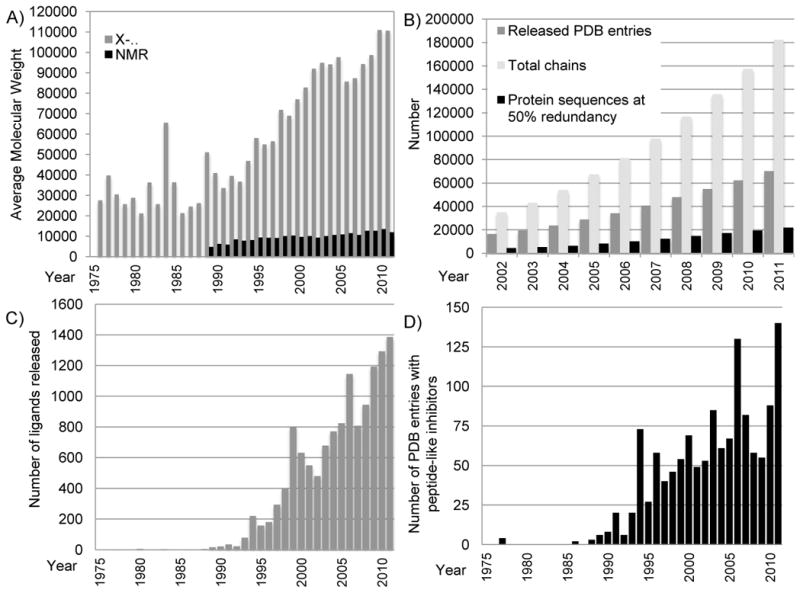
Growth in the size and complexity of PDB entries. A) Average molecular weight of entries released each year for structures determined by X-ray crystallography (for the asymmetric unit; in grey) and NMR (in black). Calculations excluded water and counted extremely large structures as single entries. For viruses and entries that used non-crystallographic symmetry (NCS), molecular weights for the full asymmetric unit were calculated by multiplying the molecular weight of the explicit polymer chains by the number of NCS operators. The large increase shown in 1984 was due to the release of the tomato bushy stunt virus 2tbv [47]. B) The number of PDB entries, total related polymer chains, and protein sequences (with 50% redundancy as calculated using blastclust [48]) available in the archive each year. C) The number of unique non-polymer ligands released each year (a single entry may have several ligands). There are three notable peaks: 73 structures with an inhibitor/antibiotic were released in 1994, the majority of which are thrombin inhibitors and renin inhibitors; 130 structures in 2006, the majority of which are thrombin inhibitors and other protease inhibitors; and 140 structures in 2011, the majority of which are protease inhibitors, including caspase inhibitors. Figures B & C reprinted from Berman [46] with permission from Wiley. D) The number of peptide-like inhibitor/antibiotic entries released per year.