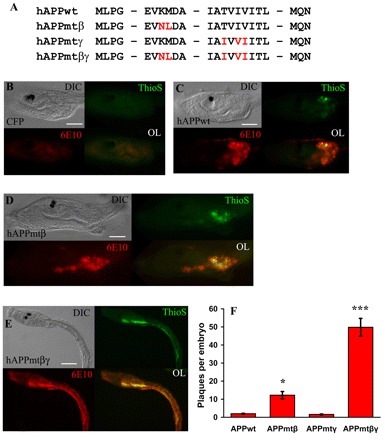
Fig. 3.

APP mutations synergize to greatly increase Aβ plaque formation in transgenic ascidian embryos. (A) Partial amino acid sequences of the wild-type (wt) and mutant hAPP695 constructs. The specific point mutations introduced by PCR are indicated in red. (B–E) Representative transgenic embryos (∼23 hpf) ubiquitously expressing CFP or hAPP. All transgenes were driven by the ef1a enhancer. Images for DIC, thioflavin S staining, mAb 6E10 staining and fluorescent overlays (OL) are shown. (B) Control transgenic embryos expressing CFP. Note the lack of thioflavin S and mAb 6E10 staining. (C) Transgenic embryo expressing hAPPwt. Note that there are some thioflavin S positive plaques and there is some 6E10 staining. (D) Transgenic embryo expressing APPmtβ. There is an increase in both thioflavin S and mAb 6E10 staining compared with either CFP-expressing or hAPP-expressing embryos. (E) Transgenic embryo expressing APPmtβγ. These transgenic embryos show the most thioflavin S and mAb 6E10 staining. (F) Quantitation of the thioflavin S-positive plaques of the embryos shown in B–E. Data are plotted as the average number of plaques per embryo ± standard error (S.E.) versus the transgene, n=50 embryos per construct. A one-way ANOVA analysis was performed on the four categories shown; F (3,196)=72.87, P=0.000. A Tukey post-hoc comparison of the four groups indicates that APPmtβ-expressing embryos had a significantly greater number of plaques compared with larvae expressing APPwt or APPmtγ, P<0.05 (*). In addition, the number of plaques in APPmtβγ-expressing larvae is much greater than for all other transgenic embryos, suggesting that mutations at both cleavage sites synergize to produce a significant increase in Aβ plaques, P<0.001 (***). Data are representative of three separate experiments. Bars, 50 μm (B–D); 100 μm (E).
