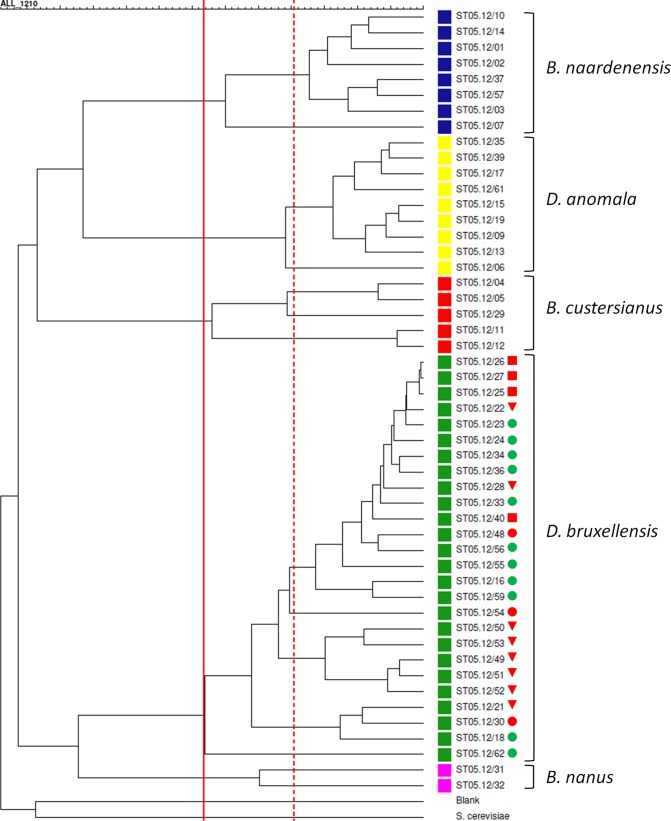
FIG 2.
Dendrogram derived from the UPGMA linkage of Pearson correlation coefficients of combined fingerprinting data sets for all Brettanomyces strains investigated in this study. Isolates from B. anomalus (Dekkera anomala) (yellow), B. (Dekkera) bruxellensis (green), B. custersianus (red), B. naardenensis (blue), and B. nanus (pink) are grouped in clusters I, II, III, IV, and V, respectively (defined at a similarity percentage of 66%, marked by the solid red line). At 80% similarity, 13 clusters can be distinguished (marked by the dotted red line); among these, the B. bruxellensis subclusters generally represent strains from a similar environment. Blank, the negative control (sterile distilled water). B. bruxellensis strains marked with a circle were shown to have the complete nitrate assimilation gene cluster, consisting of genes encoding a nitrate reductase, a nitrite reductase, and a nitrate transporter. Isolates marked with a square lost the genes encoding the nitrate reductase and nitrite reductase. Isolates marked with a triangle lost the complete nitrate assimilation gene cluster. B. bruxellensis strains that were able or unable to utilize nitrate as a nitrogen source are indicated with a green or a red mark, respectively. Isolates ST05.12/30 and ST05.12/54 (orange) were both negative on ammonium and nitrate in our assay.

