
FIG 3.
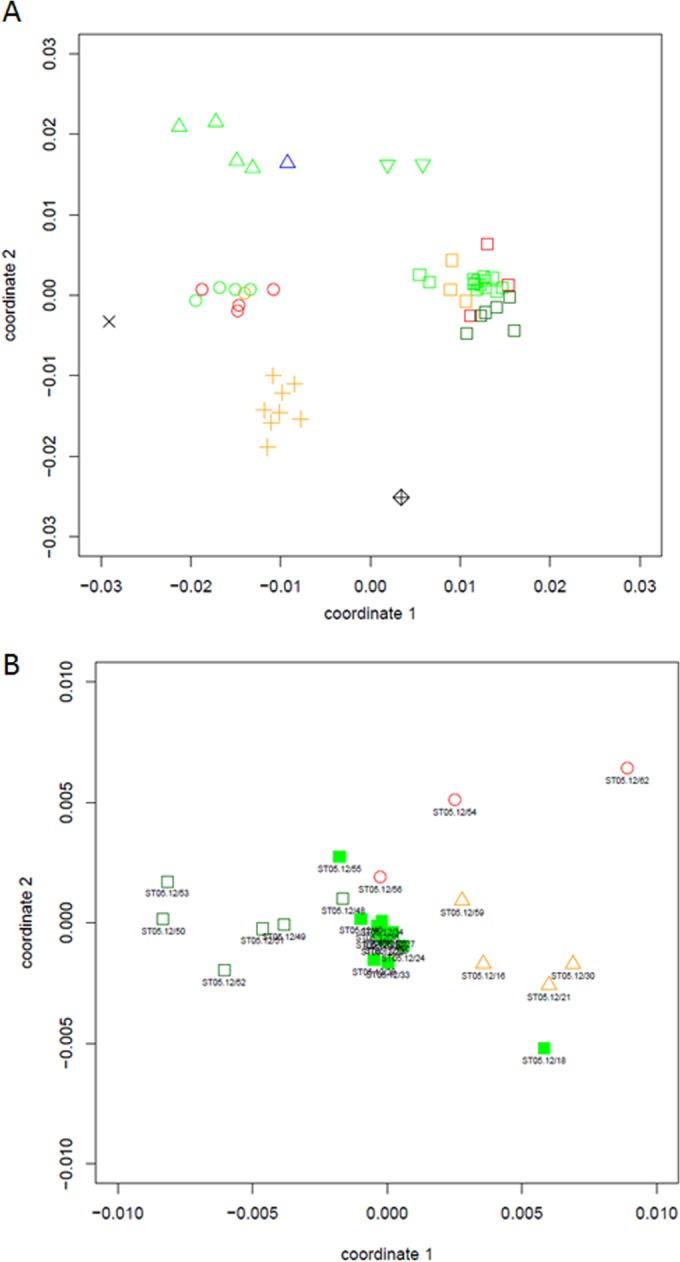
Nonmetric multidimensional scaling plot based on Pearson coefficient similarities of the combined fingerprinting data sets for all Brettanomyces isolates (A) and all B. (Dekkera) bruxellensis isolates (B) investigated in this study. In panel A, isolates from B. anomalus (D. anomala), B. bruxellensis, B. custersianus, B. naardenensis, and B. nanus are represented by circles, squares, triangles, plus signs, and inverted triangles, respectively. The diamante symbol corresponds to Saccharomyces cerevisiae, and the multiplication sign represents the negative control (sterile distilled water) (stress of plot = 0.15). The origin of the different strains, i.e., beer, Cantillon Brewery, soft drink, others, and wine, are highlighted in green, dark green, orange, blue, and red, respectively. In panel B, open dark green squares, closed green squares, red circles, and orange triangles represent B. bruxellensis isolates from the Cantillon Brewery, beer, wine, and soft drinks, respectively (stress of plot = 0.08).