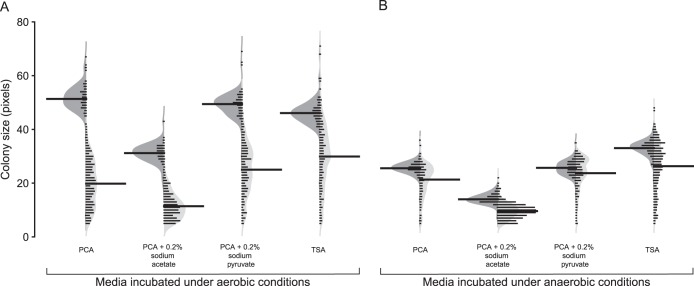
FIG 4.
Distribution of colony diameters of cultures maintained at 4°C grown on PCA, PCA with 0.2% sodium acetate, PCA with 0.2% sodium pyruvate, and TSA. Beanplot visualizations of the distribution of colony diameters measured from day 0 (dark gray) and day 84 (light gray) cultures recovered under aerobic (A) and anaerobic (B) conditions are shown. The bean lines for each half of a bean are vertical histograms of the data distribution; the thicker, longer bean lines indicate the mean of each distribution. The shape of each half of the asymmetric bean represents the Gaussian density estimation of the distribution. Data presented are from combined colony measurements of biological duplicate cultures.

