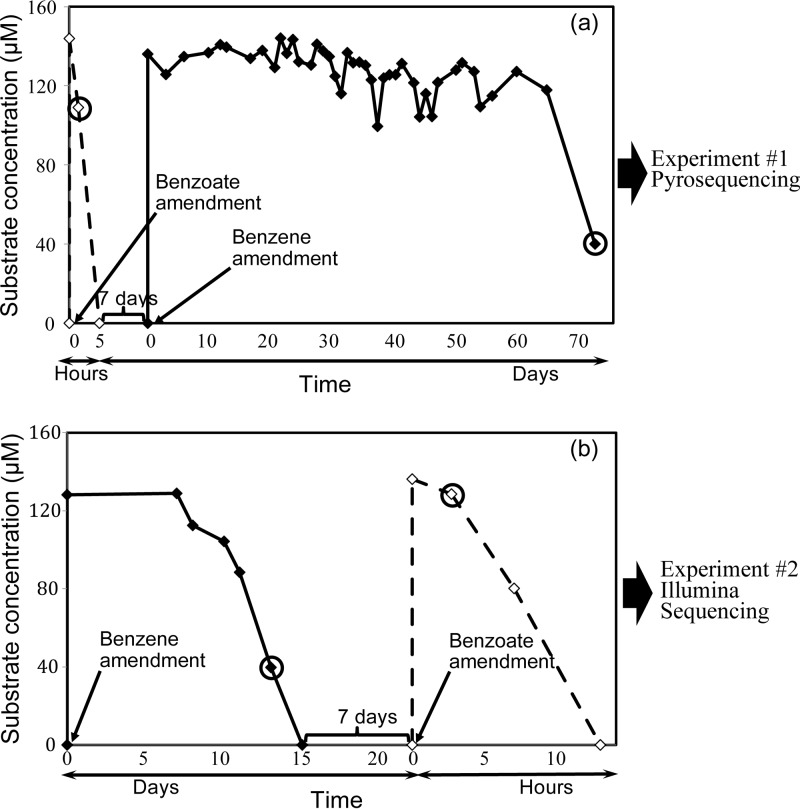
FIG 1.
Benzene and benzoate concentration profiles during differential transcriptomic experiments. Solid lines denote benzene concentrations (μM), while dashed lines show benzoate concentrations (μM). The circles identify RNA extraction sampling points. Note that the time scale varies from days (for benzene degradation) to hours (for benzoate degradation). (a) Experiment 1, benzoate followed by benzene amendment; the corresponding RNA samples were sequenced using pyrosequencing technology. (b) Experiment 2, benzene followed by benzoate amendment; the corresponding RNA samples were sequenced using Illumina technology.

