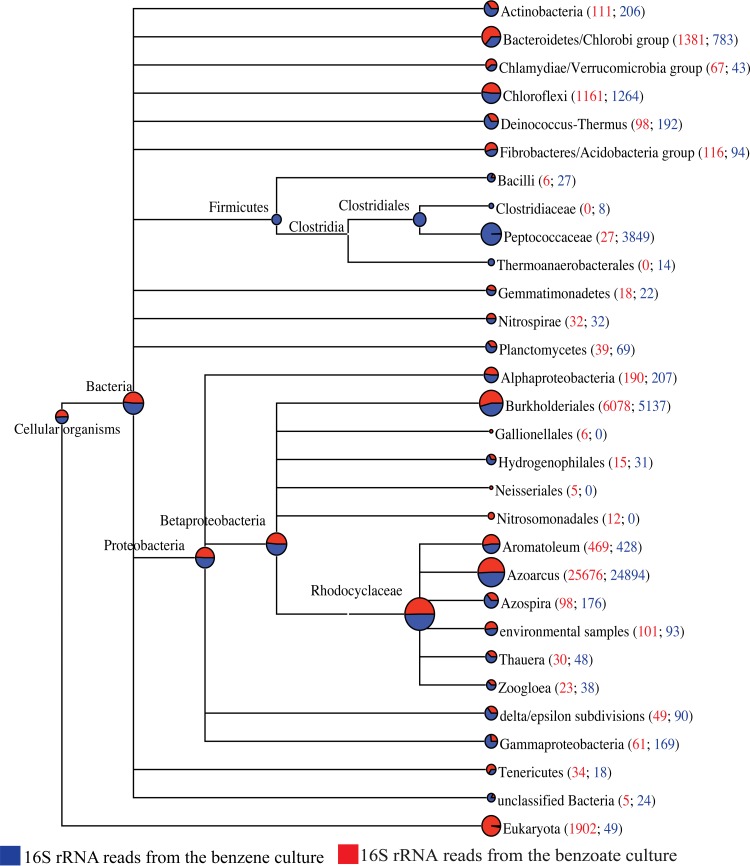
FIG 3.
Taxonomic comparison of active microbial communities from MEGAN analysis of pyrosequencing reads. Data from the benzoate-amended culture are in red, while data from the benzene-amended culture are in blue. The size of each circle at a tree node is proportional to the number of reads assigned to the corresponding taxon. The numbers in brackets are the total number of reads assigned to that node plus the number of reads in the subtree rooted at that node for each data set (benzoate; benzene). For comparison purposes, the number of reads was normalized to 100,000 reads per data set. A companion figure representing the Illumina sequence data is provided in Fig. S2 in the supplemental material.

