
FIG 3.
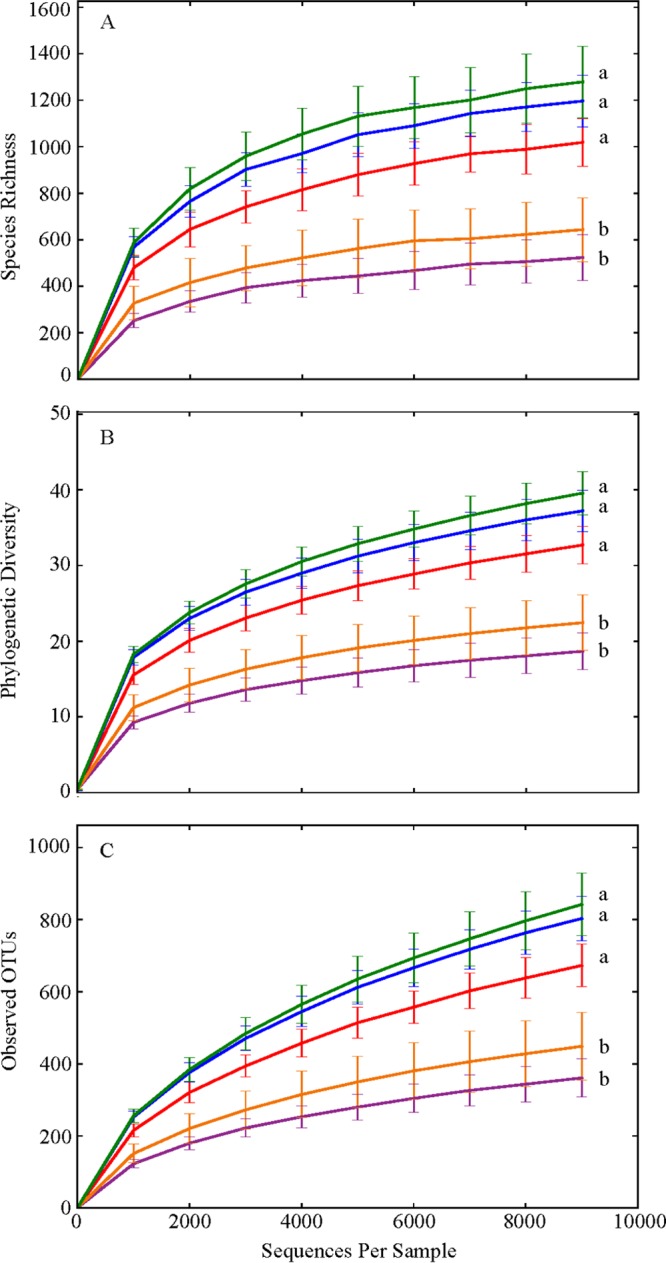
Alpha diversity rarefaction plots sorted by litter. (A) Chao1; (B) whole-tree phylogenetic diversity; (C) observed OTUs. Each line represents the alpha diversity within a litter sampled across the active season. Each point in the curve represents the mean value ± the standard error. Red, litter 11-05; green, litter 11-12; gold, litter 11-13; blue, litter 11-19; purple, litter 11-21. Letters indicate statistical differences among litters. Rarefaction plots were produced with QIIME 1.6.0.