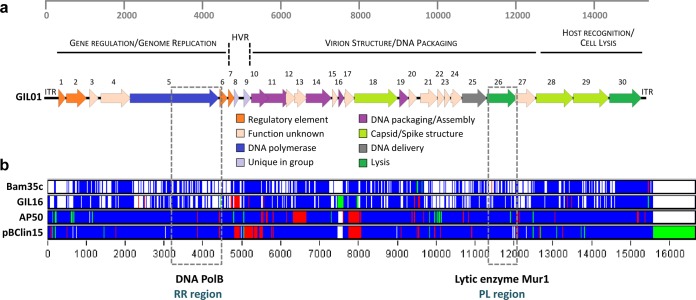
FIG 1.
Graphical representation of selected variable regions. (a) Genetic map of phage GIL01. Three gene modules based on functional grouping and similarities to other Tectiviridae in the B. cereus group are displayed. Predicted genes are represented as block arrows, and the color key at the bottom indicates postulated functions. CDS numbers are indicated. The ruler at the top represents base pairs in the GIL01 genome. ITR, inverted terminal repeat; HVR, highly variable region. (b) Whole-genome nucleotide alignments of Gram-positive bacterial tectivirus elements. For visualization, the ClustalW alignment file generated from the Multifasta alignment was summarized using Base-By-Base software (32, 33) after a model given previously (24). The GIL01 genome was used as the base sequence, and changes in other tectiviral genomes are color coded as follows: white, nucleotide identity; blue, single nucleotide polymorphism; green, insertions; and red, deletions. The ruler at the bottom represents base pairs in the whole-genome nucleotide sequence alignments. Selected variable regions (see the text), the RR and the PL regions, which mainly target the genes encoding DNA polymerase B (DNA PolB) and N-acetyl-muramidase (Mur1), respectively, are highlighted by gray dashed rectangles.

