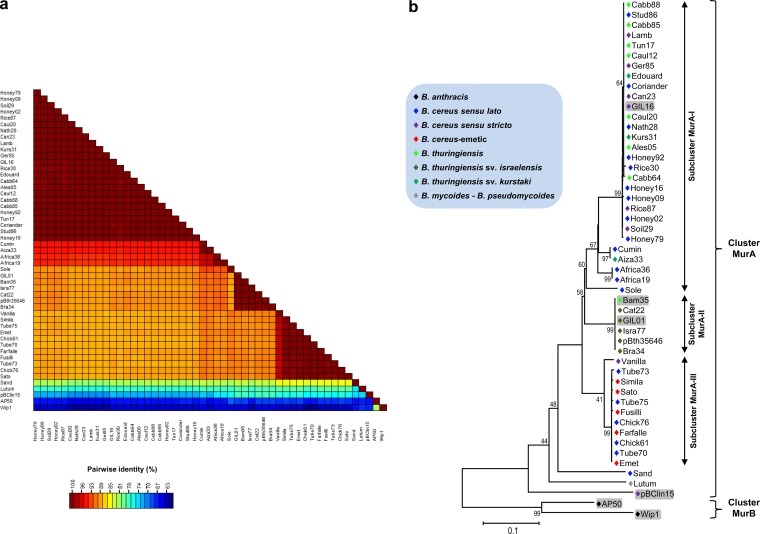
FIG 2.
Evolutionary relationships displayed by the PL region. (a) Graphical representation of percent pairwise nucleotide sequence identity of the PL region. The color scale bar indicates the percentage of nucleotide sequence identity among the 51 tectiviral isolates. (b) Maximum likelihood tree showing the genetic relationships among the new tectiviral isolates. The general time-reversible plus gamma model of nucleotide substitution was used to build the phylogenetic tree based on the PL region. Bootstrap values (1,000 iterations) above 60% are indicated for each node. Fifty-one nucleotide sequences and 581 cured positions were used for the analysis. The blue box indicates the color key for Bacillus species harboring the respective phages.

