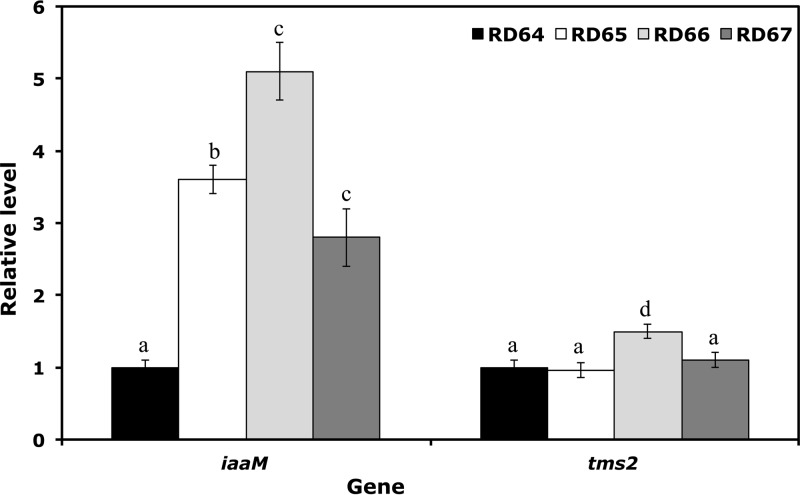
FIG 2.
Quantitative RT-PCR analysis of iaaM and tms2 genes involved in the synthesis of IAA. Values are the means ± SD of the results of four biological replicates conducted at different times. Relative gene expression levels determined by the comparative CT method are presented as follows: 2−ΔΔCT > 1, more highly expressed genes in cells transformed with the mutated construct (RD65, RD66, and RD67 cells); 2−ΔΔCT < 1, more highly expressed genes in cells transformed with the wild-type construct (RD64 cells). Different letters are used to indicate means that differ significantly according to Tukey's test (P < 0.05).

