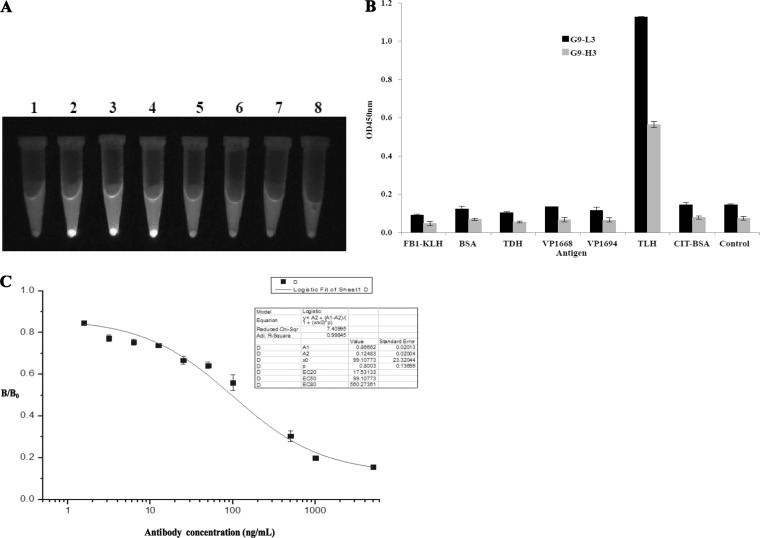
FIG 3.
Identification of GFP-based antibody. (A) Fluorescence tracking for antibodies. The different constructs were expressed at 30°C by IPTG induction, and the fluorescence levels for culture pellets after centrifugation are shown after UV exposure. Lanes: 1, scFv; 2, GFP; 3, G9-L3; 4, G9-H3; 5, G9-VL; 6, G9-VH; 7, G9-scFv; 8, BL21. (B) Specificity assay of G9-L3/H3. TLH and other correlated antigens were coated in a 96-well plate, and G9-H3 and G9-L3 antibodies were added to the wells. The specificity of the antibodies was determined using HRP-conjugated goat anti-mouse antibody. (C) ic-ELISA. The signals obtained in the presence of various inhibitor concentrations and without inhibitor (maximal signal) are referred to as “B” and “B0” (x axis), respectively. Standard curves were generated by plotting the inhibition percentage (B/B0) versus the log of free inhibitor concentrations (y axis).

