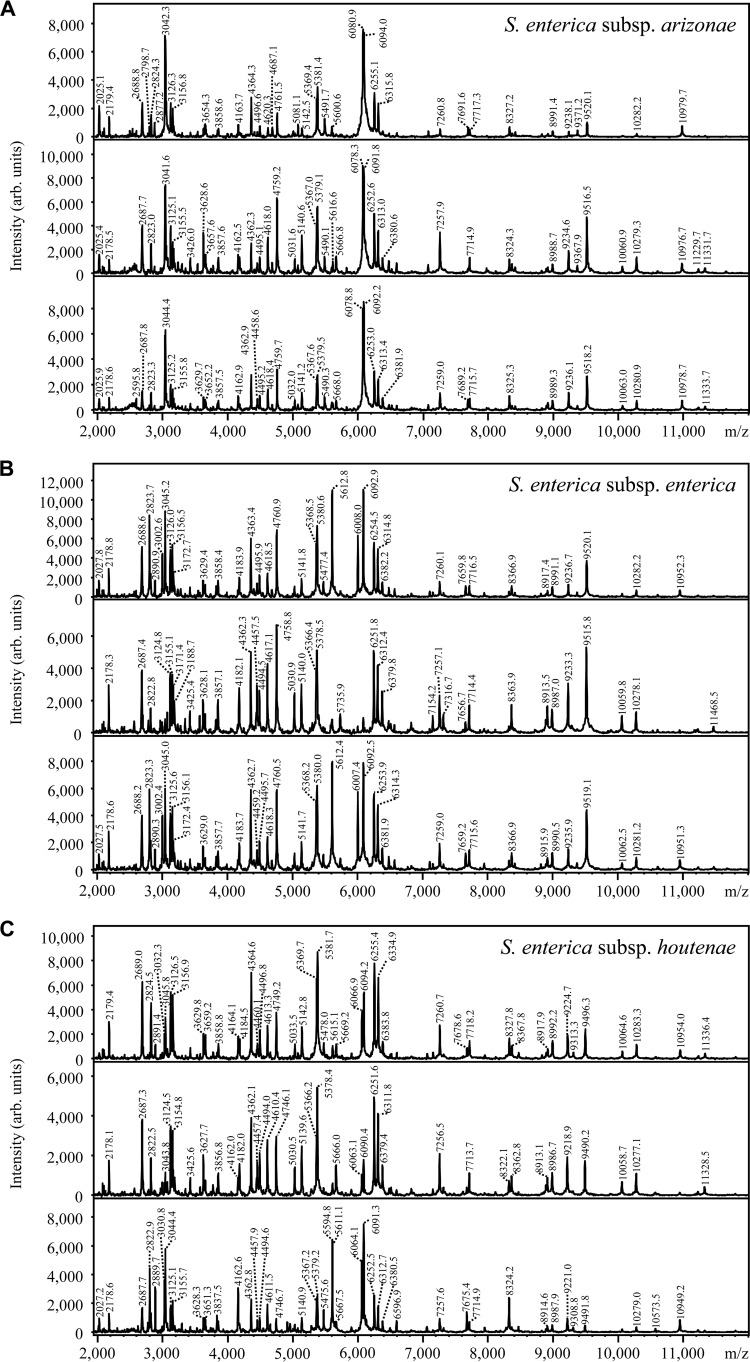
FIG 1.
MALDI-TOF MS mass spectra of cell extracts of S. enterica subsp. arizonae (A), S. enterica subsp. enterica (B), and S. enterica subsp. houtenae (C). Each experiment was performed in triplicate. The absolute intensities of the ions are shown on the y axis. The mass-to-charge (m/z) ratios of the ions are shown on the x axis, which correspond to the masses of the single positively charged ions.

