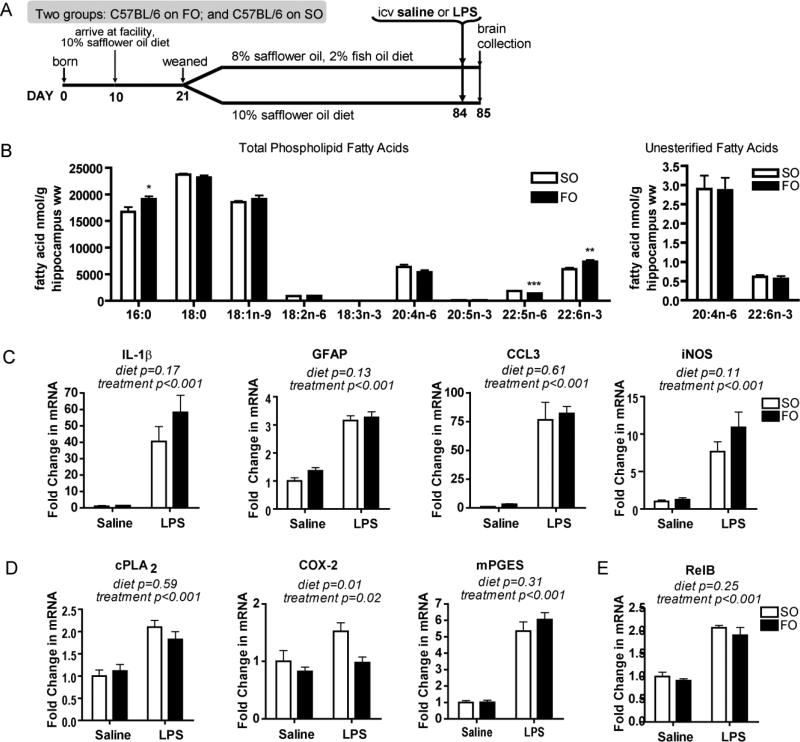
FIGURE 4.
Fatty acid and neuroinflammatory profile of C57BL/6 mice on SO and FO diets. (A) Study design. C57BL/6 mice consumed 10% safflower oil diet (SO) from 10 days of age. At weaning mice were randomized to either the SO diet or a 2% fish oil, 8% safflower oil (FO) diet. Remainder of design is similar to Fig. 1A. (B) Hippocampal (wet weight, ww) fatty acid concentrations (nmol g-1) of SO- or FO-fed C57BL/6 mice. 18:3n-3 was not detected in either group. n= 8 independent samples per group. Significantly different means represented by *p<0.05, **p<0.01, ***p<0.001 (Student's t-test). (C) Hippocampal neuroinflammatory responses of SO- or FO-fed C57BL/6 mice 24 h following icv administration of lipopolysaccharide (LPS) or vehicle (saline). Gene expression of neuroinflammatory markers, interleukin-1β (IL-1β), glial fibrillary acidic protein (GFAP), chemokine (c-c motif) ligand 3 (CCL3), and inducible nitric oxide synthase (iNOS) is not significantly different between LPS-treated SO-fed mice and LPS-treated FO-fed mice. (D) Arachidonic acid cascade markers, calcium-dependent cytosolic phospholipase A2 (cPLA2), cyclooxygenase-2 (COX-2), and microsomal prostaglandin E synthase (mPGES) are similar in SO-fed and FO-fed C57BL/6. (E) Hippocampal gene expression of NF-kB subunit RelB. Gene expression in C, D, and E compared by 2-way ANOVA followed by Bonferroni’s post-hoc if a significant interaction was found. n=6-8 independent samples per group. All data are mean ± SEM.

